
Compass projects lower qualifying scores for the Class of 2027
Every year, Compass tracks the National Merit process from the PSAT in October of junior year through the announcement of Semifinalists in September of senior year. One of the most important insights comes in April with the reveal of the national Commended cutoff. Compass has confirmed that this year’s Commended level is 208, down from last year’s 210. There has never been a year when all 50 states see lower cutoffs, but this year may come close. The Class of 2026 saw record Semifinalist cutoffs in 21 states; this year, Compass projects none. Our Semifinalist estimates have been updated with the latest information.
The junior-year PSAT is also the National Merit Scholarship Qualifying Test (NMSQT). Each year, National Merit recognizes the top 57,000 test takers. To be included in that group, students must be among the top 4% of the 1.4 million students who take the PSAT. Of that elite group, approximately 17,000 are recognized as Semifinalists for having the highest scores within their states. Semifinalists have the opportunity to continue in the program to become Finalists and, potentially, scholarship recipients. The remaining 40,000 students are recognized as Commended Students. More information can be found in our National Merit Explained post.
National Merit uses the Selection Index (SI), found on the PSAT score report, to rank students. The Selection Index is calculated by doubling the Reading & Writing score (RW), adding the Math score (M), and dividing that sum by 10. For example, a student with a 720 RW and 700 M score has a Selection Index of 214: (720 x 2 + 700) ÷ 10. The weighting of the index means that not all students with a 1420 Total Score have the same SI. A student with a 700 RW and 720 M has a Selection Index of 212. The highest SI a student can receive is 228 (760 RW and 760 M). Last year, the Commended cutoff was 210, and Semifinalist cutoffs ranged from 210 to 225 depending on the competitiveness of each state. Compass expects this year’s cutoffs to range from 208 to 223.
Why do we foresee lower cutoff scores?
The first indication of a decline was the lower number of top scorers reported by College Board when PSAT results were released in November. College Board does not release any information about the distribution of Selection Indexes, but it does produce summaries of broad score ranges. Only 52,400 students in the Class of 2027 earned scores in the 1400 – 1520 Total Score range, down 16% from the previous year. That figure is closer to what we saw two years ago with the Class of 2025 and is similar to the results for the Classes of 2017 and 2021.
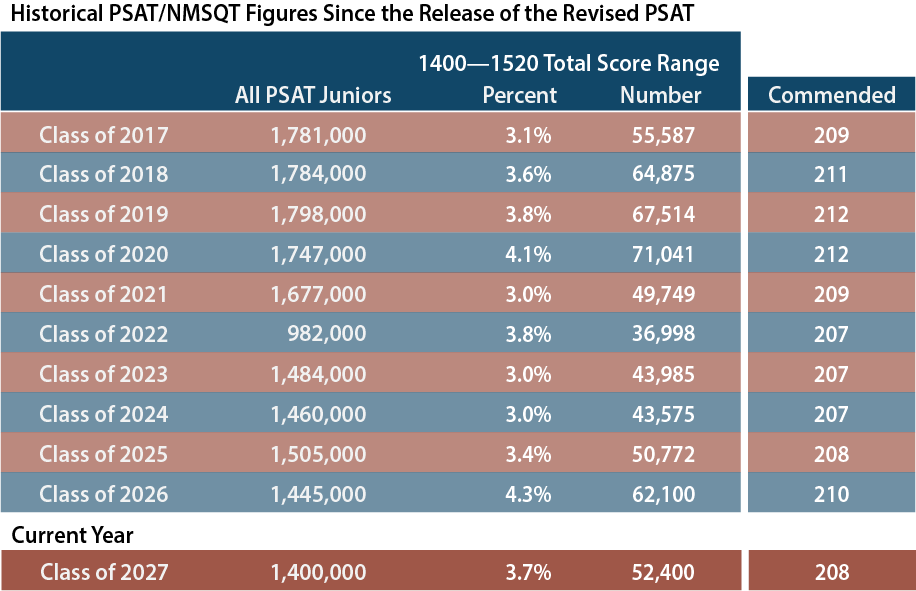
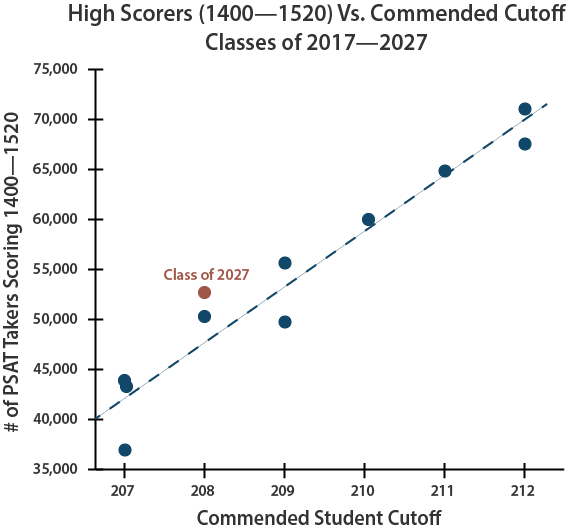
Most of the students who will qualify for National Merit recognition fall in the 1400 – 1520 band (or just outside it). With approximately 10,000 fewer students in the top band of scores this year, the Commended cutoff was bound to decline. The chart below shows the historical relationship between high scores and the Commended cutoff.
A big drop after last year’s record levels
After examining this year’s numbers, we also have a better understanding of why Semifinalist cutoffs jumped to such extreme levels last year, and why that is unlikely to happen again. The 2024 PSAT saw an unprecedented 18% jump in the number of high Reading & Writing scores (700-760). The weighting of RW in the Selection Index magnified the impact of that change. The table below shows scores for the last three years and how results have fluctuated.

On the 2025 PSAT, the number of high RW scores dropped by 27%. In fact, the RW count for this year is even lower than it was two years ago. The decline in RW scores could even produce Selection Indexes lower than those in the Class of 2025 — at least in some states.
On the October 2024 PSAT, almost as many students scored 700-760 on RW as on Math. Based on the results in the highest scoring states, we know that a record number of students achieved 750 and 760 RW scores. In most years, there would be more students scoring 730 RW and 760 M (222 SI), for example, than scoring 760 RW and 730 M (225 SI). That was not true in the Class of 2025, where there was a more equal distribution. It appears that scores for the Class of 2027 have returned to the traditional Math-heavy distribution. For this reason, we don’t believe there will be a repeat of the 224 and 225 cutoffs seen last year.
We anticipate that the majority of state Semifinalist cutoffs will decline for the Class of 2027. Knowing this overall trend, however, doesn’t tell us which states will be in that majority or how much lower scores will go. The table below provides a Most Likely cutoff score, but the more useful information is the Estimated Range. Almost all cutoffs should fall within that range.
| State | Class of 2027 (Most Likely) | Class of 2027 (Est. Range) | Class of 2026 (Actual) | Class of 2025 (Actual) | Class of 2024 (Actual) | Avg NMSFs |
|---|---|---|---|---|---|---|
| Alabama | 213 | 210 - 215 | 214 | 212 | 210 | 250 |
| Alaska | 213 | 210 - 216 | 215 | 214 | 209 | 35 |
| Arizona | 218 | 215 - 220 | 218 | 217 | 216 | 398 |
| Arkansas | 213 | 210 - 215 | 215 | 213 | 210 | 143 |
| California | 221 | 220 - 223 | 224 | 221 | 221 | 2,115 |
| Colorado | 218 | 216 - 220 | 219 | 218 | 216 | 286 |
| Connecticut | 221 | 220 - 222 | 223 | 221 | 221 | 175 |
| Delaware | 219 | 218 - 221 | 220 | 219 | 219 | 44 |
| District of Columbia | 223 | 222 - 224 | 225 | 223 | 223 | 36 |
| Florida | 217 | 216 - 219 | 219 | 217 | 216 | 999 |
| Georgia | 219 | 217 - 220 | 220 | 218 | 217 | 602 |
| Hawaii | 217 | 215 - 219 | 219 | 217 | 217 | 62 |
| Idaho | 214 | 211 - 216 | 215 | 213 | 211 | 96 |
| Illinois | 220 | 218 - 222 | 222 | 220 | 219 | 704 |
| Indiana | 216 | 214 - 219 | 218 | 217 | 216 | 313 |
| Iowa | 213 | 211 - 216 | 214 | 212 | 210 | 145 |
| Kansas | 215 | 213 - 218 | 216 | 215 | 214 | 144 |
| Kentucky | 214 | 211 - 217 | 214 | 213 | 211 | 201 |
| Louisiana | 214 | 212 - 217 | 216 | 214 | 214 | 222 |
| Maine | 214 | 212 - 217 | 217 | 214 | 213 | 55 |
| Maryland | 222 | 220 - 224 | 224 | 222 | 221 | 308 |
| Massachusetts | 223 | 221 - 224 | 225 | 223 | 222 | 318 |
| Michigan | 218 | 216 - 220 | 220 | 218 | 217 | 485 |
| Minnesota | 218 | 216 - 220 | 219 | 217 | 216 | 279 |
| Mississippi | 212 | 210 - 214 | 213 | 212 | 209 | 155 |
| Missouri | 215 | 213 - 218 | 217 | 215 | 214 | 289 |
| Montana | 210 | 208 - 213 | 213 | 209 | 209 | 47 |
| Nebraska | 212 | 210 - 215 | 214 | 211 | 210 | 105 |
| Nevada | 214 | 211 - 216 | 214 | 214 | 211 | 168 |
| New Hampshire | 216 | 214 - 219 | 219 | 217 | 215 | 60 |
| New Jersey | 223 | 222 - 224 | 225 | 223 | 223 | 451 |
| New Mexico | 212 | 209 - 214 | 210 | 211 | 207 | 104 |
| New York | 220 | 219 - 223 | 223 | 220 | 220 | 1,012 |
| North Carolina | 218 | 216 - 220 | 220 | 218 | 217 | 510 |
| North Dakota | 209 | 208 - 212 | 210 | 210 | 207 | 30 |
| Ohio | 217 | 215 - 219 | 219 | 217 | 216 | 538 |
| Oklahoma | 212 | 210 - 214 | 212 | 211 | 208 | 204 |
| Oregon | 217 | 215 - 220 | 219 | 216 | 216 | 188 |
| Pennsylvania | 219 | 217 - 221 | 221 | 219 | 219 | 596 |
| Rhode Island | 217 | 214 - 219 | 219 | 217 | 215 | 47 |
| South Carolina | 214 | 210 - 216 | 215 | 214 | 209 | 236 |
| South Dakota | 209 | 208 - 212 | 211 | 208 | 209 | 42 |
| Tennessee | 217 | 215 - 219 | 219 | 217 | 217 | 319 |
| Texas | 219 | 218 - 222 | 222 | 219 | 219 | 1,623 |
| Utah | 212 | 210 - 215 | 213 | 211 | 209 | 196 |
| Vermont | 214 | 211 - 216 | 216 | 215 | 212 | 28 |
| Virginia | 222 | 220 - 224 | 224 | 222 | 219 | 437 |
| Washington | 222 | 220 - 224 | 224 | 222 | 220 | 348 |
| West Virginia | 208 | 208 - 211 | 210 | 209 | 207 | 64 |
| Wisconsin | 214 | 213 - 217 | 215 | 214 | 213 | 292 |
| Wyoming | 209 | 208 - 212 | 210 | 209 | 207 | 24 |
| U.S. Territories | 208 | 208 - 208 | 210 | 208 | 207 | 39 |
| Outside U.S. | 223 | 222 - 224 | 225 | 223 | 223 | 86 |
| Commended | 208 | 208 - 208 | 210 | 208 | 207 |
Was last year a fluke, shift, or a trend?
The results from the Class of 2027 have answered one of the nagging questions from last year: Were the high cutoffs a fluke, shift, or trend? The answer appears to be fluke. More accurately, results could be labeled an error in test construction and scaling. There is no evidence that the Class of 2026 possessed special test-taking skills. As sophomores, that class performed in line with expectations on the 2023 PSAT. There is no evidence that the Class of 2027 has diminished skills. As sophomores, the class saw the same inflated scores as did the juniors on the 2024 PSAT. The best explanation is that College Board lost control of the scale. College Board dramatically shortened the PSAT when it switched from paper to digital. On the paper test, the Reading and Writing sections had 91 questions, and students were given 95 minutes. The RW on the digital PSAT is truncated to 54 questions over 64 minutes. And only 50 of the questions count toward a student’s score! A shorter exam means a less reliable exam. We saw the occasional wild ride on the paper PSAT, but the rides may get wilder and more frequent on the digital PSAT.
How cutoffs are determined
Qualifying scores (“cutoffs”) are not based on the total score for the PSAT (360-1520) but on the Selection Index, which is calculated by doubling the RW score, adding the Math score, and then dividing the sum by 10. The maximum Selection Index is 228. Students can find a historical set of cutoff data here or see how Semifinalist and Commended counts have changed state by state.
While the Commended cutoff is the same across the entire country, Semifinalists cutoffs vary by state. NMSC allocates a target number of Semifinalists to states based on their population of high school juniors, not all of whom take the PSAT. If Florida is allocated 1,000 Semifinalists based on its population of high school graduates, then NMSC works down from a perfect 228 Selection Index until it gets as close as possible to that target. Last year, 1,008 students scored at or above the cutoff of 219. A cutoff of 220 would have produced too few Semifinalists. A cutoff of 218 would have gone over the allocation. Because score levels can get crowded, it is easy for cutoffs to move up or down a point even when there is minimal change in testing behavior or performance. All students at or above a cutoff qualify.
Why does each state have its own Semifinalist cutoff if the program is NATIONAL Merit?
This is always a hot button question. NMSC allocates the approximately 17,000 Semifinalists among states based on the number of high school graduates. That way, students across the nation are represented. It also means that there are very different qualifying standards from state to state. A Massachusetts student with a 220 might miss out on being a Semifinalist. If she lived 10 miles away in New Hampshire, she would qualify.
No Semifinalist cutoff can be lower than the national Commended level. Cutoffs for the District of Columbia and for U.S. students studying abroad are set at the highest state cutoff (typically New Jersey). The cutoff for students in U.S. territories and possessions falls at the Commended level each year. Boarding schools are grouped by region. The cutoff for a given region is the highest state cutoff within the region.
Change is always the theme
Over the last two decades, at least half of the state cutoffs have changed each year. In some years, as many as 49 states saw ups or downs, usually because of questionable test forms. In addition to last year’s exam, the PSATs from 2011 (Class of 2013), 2016 (Class of 2018), and 2019 stand out as problematic. The anomalous 2019 results could be traced back to a particularly mis-scaled form, which I wrote about at the time. The Class of 2014 also saw significant changes, but those were more of a bounce-back from the previous year. The question for the Class of 2027 is how much of a bounce-back will be seen this year.

Cutoffs are particularly bumpy in states with smaller pools of test takers and National Merit Semifinalists. Over the last dozen years, cutoffs in the 12 largest states have remain unchanged 36% of the time, while the cutoffs in the smallest states have remain unchanged only 1 time out of every 5. No large state’s cutoff has jumped by more than 3 points in a year, whereas 6-point changes have occurred in the pool of smaller states.

When are National Merit Semifinalists announced?
The lists of Semifinalists will not be distributed to high schools until the end of August 2026. With the exception of homeschoolers, students do not receive direct notification. NMSC asks that schools not share the results publicly until the end of the press embargo in mid-September, but schools are allowed to notify students privately before that date. NMSC does not send Commended Student letters to high schools until mid-September. Compass will keep students updated on developments as the dates approach.
Do state and national percentiles indicate whether a student will be a National Merit Semifinalist?
No! Approximately 1% of test takers qualify as Semifinalists each year, so it is tempting to view a 99th percentile score as indicating a high enough score — especially now that College Board provides students with percentiles by state. There are any number of flaws that rule out using percentiles as a quick way of determining National Merit status.
- Percentiles are based on section scores or total score, not Selection Index
- Percentiles are rounded. There is a large difference, from a National Merit perspective, between the top 0.51% and the top 1.49%
- Percentiles reveal the percentage of students at or below a certain score, but the “at” part is important when NMSC is determining cutoffs.
- The number of Semifinalists is based on the number of high school graduates in a state, not the number of PSAT takers. Percentiles are based on PSAT takers. States have widely varying participation rates.
- Most definitive of all: Percentiles do not reflect the current year’s scores! They are based on the prior 3 years’ performance. They are set even before the test is given. And if you are going to use prior history, why not use the record of prior National Merit cutoffs rather than the highly suspect percentiles?
Entry requirements for National Merit versus qualifying for National Merit.
Your PSAT/NMSQT score report tells you whether you meet the eligibility requirements for the NMSP. In general, juniors taking the October PSAT are eligible. If you have an asterisk next to your Selection Index, it means that your answers to the entrance questions have made you ineligible. Your answers are conveniently noted on your score report. If you think there is an error, you will also find instructions on how to contact NMSC. Meeting the eligibility requirements simply means that your score will be considered. Approximately 1.4 million students enter the competition each year. Only about 55,000 students will be named as Commended Students, Semifinalists, Finalists, or Scholars. See National Merit Explained for more information.

Hi Art.
Have you heard from anyone else from NC? It looks like all the other States are staying the same or going down in cut off, but NC went up. My DD got a 220. Do you think there is still a chance for that 221 to go down? Thank you so much! 🙂
BEVM,
Absolutely. I think that may be the only NC report, so there is no reason it would be exactly at the cutoff.
Senior from NJ here. Counselor gave me the letter yesterday and I qualified with a 225.
Congratulations, CD! I got news from a reliable source that NJ came in at 223, so you cleared it with ease!
Thank you so much for your diligence in keeping us updated. My DD made it. Thanks so much!!
Hi Art.
Do you think that the Rhode Island index will dip any more? Possibly to a 217? Thank you so much
David,
Rhode Island is not yet confirmed, but I don’t think we are going to see any 3-point drops this year.
My son qualified with 219 in Hawaii. Down at least 1 point from last. I do not know the cutoff.
Congratulations, Kate! I’ve updated the site based on your report.
Any chance we see a 2-point drop in CT, Art? Son got a 1480 but got the 760 in Math. Needed it to be the other way around.
Thanks,
Dave
Dave,
I’m trying to get final confirmation, but it looks like it is only going down to 221. The ERW weighting and the PSAT’s 760 cap can make it tough for students who skew Math.
Hi, I was just wondering how you confirm the validity of the reported scores that made the cutoff? Do you just rely on what people comment on here, or is there a process to check? (Basically I got 221 in TX and want to know if I should get my hopes up)
Terry,
The information comes from a mix of reports and sources. If I have a reliable source, I will mark the information as “confirmed.” Otherwise I’ve tried to list the number of reports received at a particular score level. I’ve been fortunate to find that student reports are very reliable. I think you are safe to celebrate!
Thrilled to hear MO is <= 217 … no official word from our school yet though – any chance you have more than one confirmation?
A busy day for confirmations, but I don’t yet have MO nailed down. Single report at the moment. *knock wood* No incorrect reports thus far.
IS 218 really for OH? OMG! My son sit on 218, we thought there is no hope at all.
Grace,
It’s real. Congratulations!
Is there a chance that PA could also fall one point to 219?
Unfortunately, I’ve just confirmed that PA will remain at 220.
AR <=214
Congratulations, Patrick! Just updated the site with your information.
Art your report outs have been super helpful! In CA have not heard anything from school (@212 so the three that have reported give us joy) , so thanks to all who have provided CA updates. What is the process if school just never communicates? Are they not required by NMSC to tell students and provide the application packet else students that are semifinalists miss the chance to apply for finalists?
The school ultimately needs to communicate the information, because it provides the credentials and submits the final application. Many schools wait until the press release date, and some either wait longer or haven’t received all of the materials. The San Jose Mercury News usually releases the NMSF state list, so California students have that going for them. [I think you mean 222.]
Yes @222 hence good news for us in CA – NOT 212 that was a typo sorry.
Dear Art,
Sincerely appreciate your time and your compassionate for our anxious parents and seniors. Salute!
Sincerely, a Texas-221 mom
It’s nice to be able to share my esoteric knowledge from time to time. Thank you. Congratulations to your student!
Art,
Thank you for all of this information! Do you know what the minimum ACT score will be required for National Merit?
Michelle
Michelle,
It’s complicated, so I finally added a section to our National Merit FAQ.
Nothing from MD…
Soon, I hope.
Any chance it will rise above NJ?
None.
Hi Art! Just wanted to know if your source for the MI cutoff was reliable? I’ve just been very anxious since I’m sitting right at a 219 and I don’t want to get my hopes up too much.
It’s reliable. Congratulations! I hope you get notification from your school soon.
Any word from Virginia? sitting on a 221 and watching a bunch of states drop a point, so its a stressful time.
I wanted to respond directly before posting the confirmed cutoff. Unfortunately, Virginia has remained at 222 this year.
Hello Art
My daughter received a selection index of 222 (760 math, 730 RW). We live in California, but she attends a prep school in Massachusetts. I read somewhere that in this case the state used for the cutoff depends on the number of out of state students that attend the school, with 40% being the magic threshold. Can you confirm (or deny) any of that? I believe at her school 57% of the students are from Massachusetts, and the remaining 43% are out of state/international students.
Can you tell me if California’s cutoff of 222 or Massachusetts’s cutoff of 223 applies to her? In our case, that 1 point makes a world of difference!
Thanks!
Kevin,
My understanding is that, unfortunately, 223 is going to be your daughter’s cutoff. I hadn’t heard the exact 40% figure; in NMSC literature, they talk about “predominantly out-of-state” The catch is that the location or status of a student’s high school — not residency — determines eligibility. If your daughter’s school is not a boarding school, then she is a MA student with an MA cutoff. If her school IS a boarding school, then her cutoff is the highest state cutoff in the Northeast. That cutoff is MA. I’d like to be wrong on this.
Thank you for that interpretation. I won’t shoot the messenger!
My son will make the cut for MO. Will we start to receive targeted mailings/calls from schools that are interested or will we still be out there hitting university websites and other resources to understand the doors that are opening? Q2 is: are there schools who “quietly”recruit NMF without putting it out there as automatic scholarships?
Wayne,
I spend my days thinking about testing, so I’m well-versed in that area. The experts on the scholarship side tend to be your fellow parents. The National Merit forum at collegeconfidential.com will always have threads going about the best opportunities. While your son will likely receive mailings, I strongly recommend that you proactively search out opportunities. Yes, NMSF or NMF status can be a plus factor at colleges that do not offer scholarships. One pro tip is not to waste a “First Choice” on a college that does not provide National Merit scholarships. Congratulations, btw!
My son qualified in MT with a 215.
Great to hear from Montana. Congratulations to your son!
I am from DE. 222 made into NMSF selection
Congratulations! It looks like DE’s cutoff is 220 this year (down 2). Great job.
A little confused on how this works so if you know….Daughter is semi-finalist and plans to go to Bama. Bama offers a full free ride with finalist standing. Meal-plan is not included. Question is: if daughter qualifies for other outside scholarships can they cover meal plan and what happens if you qualify for more than meal plan covers? Just wondering how hard she should be trying to get outside scholarships. She is over the moon excited about getting semi finalist and don’t want to expect anything but very confused about the 7,500 who get national merit scholarships opposed to just that Bama gives to any nmf.
Michelle,
Your best bet is to talk directly to Alabama. I believe outside awards are stackable rather than offsetting Bama’s NMF award. She does still need to qualify as a Finalist.
If her first choice is Bama, I wouldn’t worry about the other NM scholarships, although the liaison at Bama should be able to give you guidance there, too. This all falls a bit outside my area of expertise. For curious readers: https://scholarships.ua.edu/freshman/nationalscholars/. Very exciting!
Hi Art
My son scored a 214 and he is in a school in Oklahoma. The last few years the cutoffs have been higher for this state . Are there confirmed cutoffs available fort Oklahoma?
I can now confirm OK at 214. He just made it!
Hi Art
My scored a 214 and is in school in Oklahoma. The state had higher cutoffs past few years. Do we have a confirmed cutoff for Oklahoma?
Thanks
Bini,
A number of states are seeing small drops, and OK is one of them. Your student hit the cutoff right on the nose. Congratulations!
My daughter heard from her school counselor this morning that she is a national merit finalist with the 221 in WA. Thank you for your wisdom these last few days!
Great news! Thank you for the kind words.
Thank you Seattle Mom. I’ve been anxiously watching for news from Washington state. I figured our counselors were bogged down with schedule changes since we just started school, so I expected to wait until next week. So grateful for Art’s blog and the parents who are willing to share information.
So if schools say on their website that they provide full tuition, room/board, tech fee, etc. for students that become National Merit Finalists, does that mean that this is done through the college sponsored scholarships within the National Merit competition or is the scholarship listed on their website available to anyone who achieves finalist status, regardless of scholarships received through National Merit Corporation? For example, if someone was named a finalist and did not receive a scholarship through National Merit, would they qualify for the scholarship listed on the school website, or is the listing just acknowledging their college sponsored scholarship that can be won through the competition?
Amelia,
Sorry for the really late answer, but since Finalists aren’t determined yet, I figure that the answer might still prove useful. If you are a Finalist and put a sponsoring school as first choice, you will probably receive that award. The only reason I mention “probably” is that some schools limit the number of awards. In most cases you will be fine. Contact the school’s financial aid department for more information. There is usually someone who specializes in National Merit, especially at schools that provide full rides. Not to confuse things further, but the full-ride is not technically an NMSC scholarship. It’s the school using NMSC as a sort of clearinghouse. Students who don’t win a school-sponsored award are considered for a direct NMSC award.
Bottom line: make Finalist, list school as first choice, likely receive award.
Art – my daughter (at 225) absolutely refuses to accept that she is a semi-finalist because someone could be reporting scoes as a cruel joke. When you say “confirmed” is there room for that type of misinformation? thanks.
EML,
A) All confirmed. No cruel jokes. B) I will personally guarantee that a 225 will qualify as NMSF from now until at least the next time CB overhauls the exam.
IRL I’m a skeptic, too, so I can understand her refusal. She’ll be receiving notification soon enough. Congratulations!
Art, Thanks so much for sharing your tremendous expertise with us. I really appreciate all your efforts!
Username means NMSF, so congrats! Thank you for the kind words.