
November 13: Updated with final wave of PSAT scores.
College Board released scores in three waves depending on when students took the PSAT. We have now received scores summaries for all three waves. It is possible that some late scores will still dribble in, but we are not expecting any changes. The results point to a strong upward trend in cutoffs for the class of 2026. You are welcome to jump to the table of estimates below, but we encourage students and families to read more about how we came to those estimates. For more information on the National Merit Program, in general, you may want to read Compass’s National Merit Scholarship Program Explained. If you want to browse almost two decades’ worth of cutoffs, you can find them in Compass’s National Merit Historical Cutoffs.
What is a Semifinalist Cutoff?
Each year almost 17,000 juniors are named Semifinalists in the National Merit Scholarship Program and continue on in the hopes of being one of the 15,000 Finalists and, eventually, one of the 7,500 scholarship recipients. The score needed to qualify as a Semifinalist varies by state and is known as the “cutoff.” Every student scoring at or above the Semifinalist cutoff qualifies. The cutoff is not based on a student’s overall PSAT score but on the Selection Index. The Selection Index is listed on a student’s PSAT score report. It can be calculated by doubling the ERW score, adding the Math score, and then dividing the sum by 10. For example, a 720 ERW / 730 M would have a Selection Index of (720 x 2 + 730)/10 = 217. For the class of 2025, cutoffs ranged from 208 to 223.
What is a Commended Student Cutoff?
If you performed well on the PSAT but do not qualify as a Semifinalist, you have the opportunity to be named as a Commended Student. Unlike the Semifinalist cutoffs, the Commended cutoff is set nationally. For last year’s class it was 208. Approximately 36,000 students are named Commended Students each year.
Why does Compass believe that we are likely to see cutoffs, as a whole, go up?
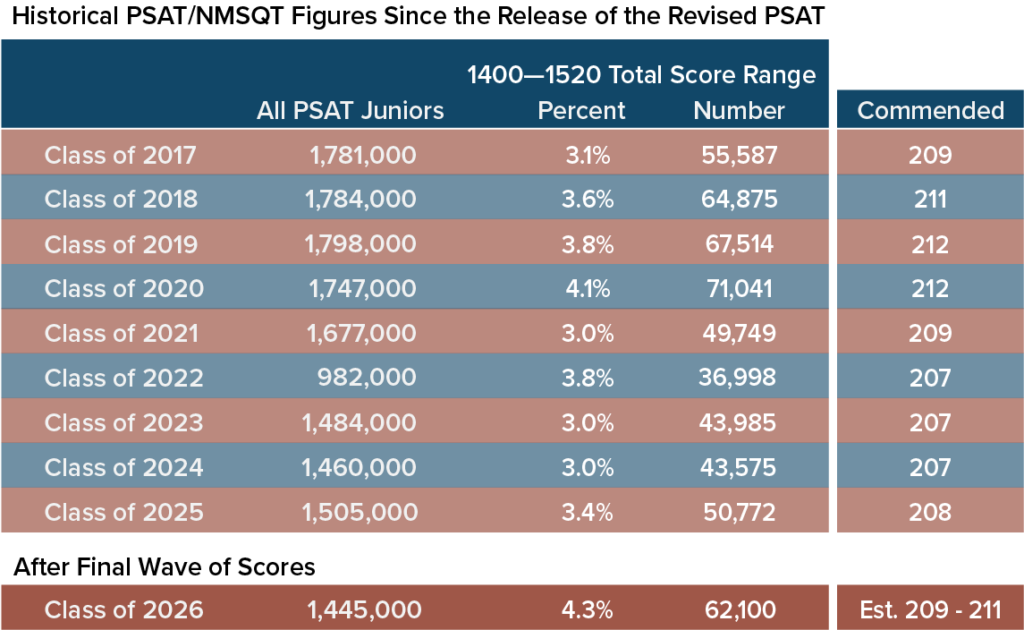
College Board releases very little data about score distribution. The number of top scorers is the most critical piece of information that we get this early in the process. While we do not know the number of students scoring at a particular Selection Index, we do know the number of students scoring in the 1400-1520 range, which roughly correlates to Selection Indexes of 210-228. The class of 2026 ranks 4th in the ten years since the PSAT scoring was overhauled, and this year sees the highest ever percentage of top scores. The number of Semifinalists and Commended students are capped, so cutoffs are likely to rise. But not all cutoffs. The numbers we have seen are at the national level and there is always churn at the state level. What we believe, however, is that more cutoffs will go up than down.
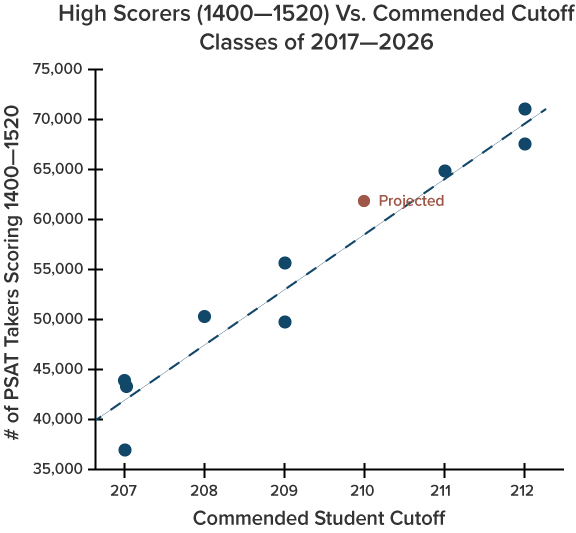
There is a good correlation between the 1400-1520 band of students and the Commended Student score. We believe that the Commended cutoff will come in between 209 and 211, with a 210 being most likely. Based on our historical archive of Semifinalist and Commended cutoffs, we believe that the average Semifinalist cutoff will go up this year.
Will I find out my status right away?
No. In fact, students don’t learn of Semifinalist status until September of senior year. Compass tracks data on current year performance and historical records to provides estimates and updates between PSAT score release and the Semifinalist announcements. Last year — the first year of the digital PSAT — saw a noticeable uptick in scores. Only one state — South Dakota — saw a lower cutoff versus the previous year’s. Was this a onetime quirk? Based on early results for the class of 2026, we do not believe that it was. The upward trend — whether due to the new test format, recovery from COVID-era learning loss, or other factors — appears to be continuing.
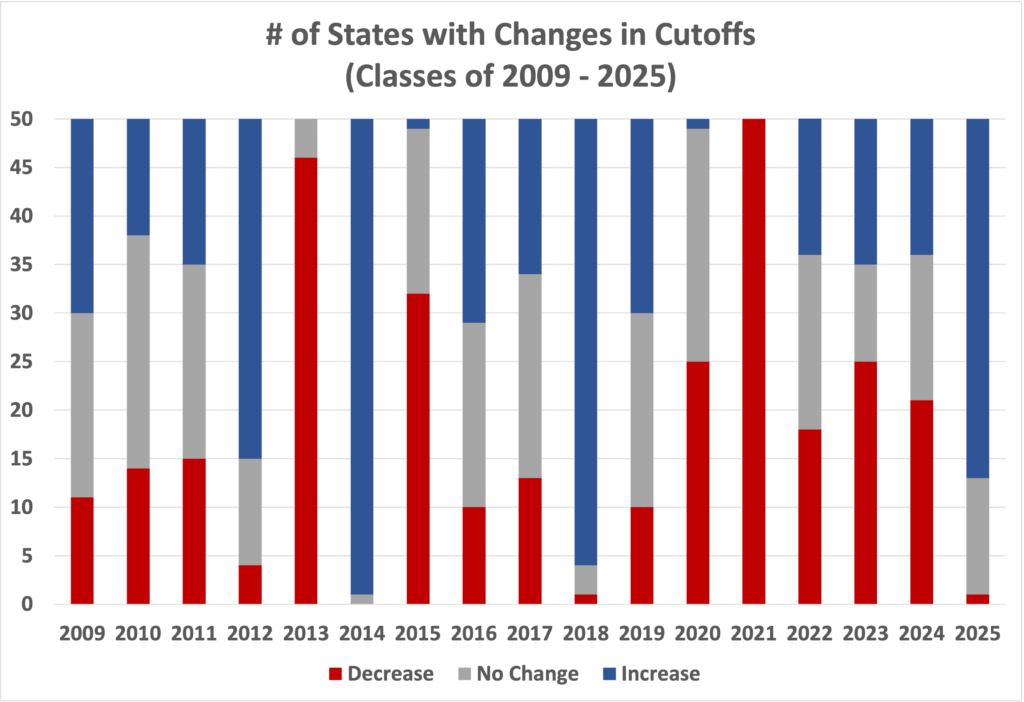
One mistake students make is thinking that the cutoff for one year will be the same in the next year. Cutoffs change every year, sometimes by as much as 5 or 6 points (granted, that’s unusual). Compass emphasizes an Estimated Range, which is likely to include the ultimate cutoff. Within that range, we do provide our Most Likely. That score represents our best estimate based on the known factors, but there are many unknown factors. Most of our PSAT performance data are for national results. So we can usually peg the Commended cutoff within a point or two. States, however, can move in different directions. More Alaskan students may test this year. Some strong Rhode Island prep schools may have decided to stop offering the PSAT. A COVID outbreak in Montana could mean more students using Alternate Entry and entering the competition using SAT scores. Below is a table that shows how many states in each of the last 17 years saw increases, decreases, or no change. There has never been a year where even half of all state cutoffs remain unchanged.
The chart below divides the 50 states into those that saw increases (blue), those that remained unchanged (gray), and those that saw declines (red).
Historically, a change in cutoff is more likely than not. Over the decade from 2015 – 2024, Semifinalist cutoffs remained unchanged only about one-third of the time.
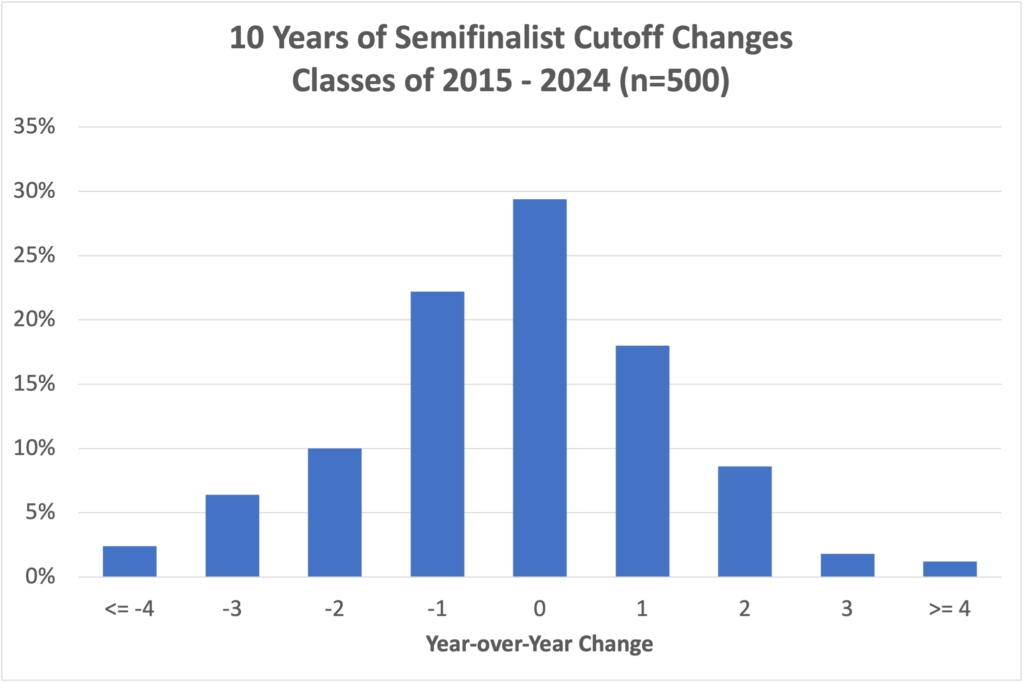
We believe that a table of results from this class will skew to the right.
Small states have more volatile cutoffs than large states, but there can be surprises across the board. The PSAT had a significant overhaul in scoring in 2017. If we look at the minimum and maximum cutoffs during the 9-year period from then until the class of 2025, we see that the 13 largest states (about 100,000 or more high school graduates) average a 2.8-point differential. New Jersey has a 1-point differential, since its lowest cutoff is 222 and highest is 223. The smallest states (fewer than 30,000 graduates) have a 6.2 point differential. Alaska has been as low as 208 and as high as 217! The medium-sized states average a 5-point difference between minimum and maximum.
Here are Compass’s current estimates for Semifinalist cutoffs for the class of 2026:
State | Class of 2026 Estimated Range | Class of 2026 Most Likely | Class of 2025 (Actual) | Class of 2024 (Actual) | Class of 2023 (Actual) | # of 2025 Semifinalists |
|---|---|---|---|---|---|---|
| Alabama | 210 - 216 | 214 | 212 | 210 | 212 | 267 |
| Alaska | 210 - 216 | 214 | 214 | 209 | 210 | 36 |
| Arizona | 215 - 220 | 218 | 217 | 216 | 214 | 401 |
| Arkansas | 210 - 215 | 213 | 213 | 210 | 210 | 134 |
| California | 220 - 223 | 222 | 221 | 221 | 220 | 2103 |
| Colorado | 216 - 221 | 218 | 218 | 216 | 217 | 272 |
| Connecticut | 220 - 222 | 221 | 221 | 221 | 221 | 177 |
| Delaware | 218 - 221 | 220 | 219 | 219 | 218 | 43 |
| District of Columbia | 222 - 224 | 223 | 223 | 223 | 223 | 47 |
| Florida | 216 - 220 | 218 | 217 | 216 | 216 | 972 |
| Georgia | 217 - 221 | 219 | 218 | 217 | 218 | 624 |
| Hawaii | 215 - 220 | 218 | 217 | 217 | 215 | 74 |
| Idaho | 212 - 217 | 214 | 213 | 211 | 215 | 102 |
| Illinois | 218 - 222 | 220 | 220 | 219 | 219 | 738 |
| Indiana | 214 - 219 | 217 | 217 | 216 | 214 | 304 |
| Iowa | 211 - 217 | 214 | 212 | 210 | 212 | 156 |
| Kansas | 213 - 219 | 216 | 215 | 214 | 214 | 142 |
| Kentucky | 211 - 217 | 214 | 213 | 211 | 212 | 202 |
| Louisiana | 212 - 217 | 215 | 214 | 214 | 213 | 238 |
| Maine | 212 - 217 | 215 | 214 | 213 | 215 | 53 |
| Maryland | 221 - 224 | 222 | 222 | 221 | 222 | 296 |
| Massachusetts | 221 - 224 | 223 | 223 | 222 | 220 | 294 |
| Michigan | 216 - 220 | 218 | 218 | 217 | 218 | 511 |
| Minnesota | 216 - 220 | 218 | 217 | 216 | 216 | 288 |
| Mississippi | 210 - 215 | 213 | 212 | 209 | 210 | 155 |
| Missouri | 214 - 218 | 216 | 215 | 214 | 213 | 276 |
| Montana | 208 - 213 | 210 | 209 | 209 | 207 | 45 |
| Nebraska | 210 - 216 | 213 | 211 | 210 | 212 | 118 |
| Nevada | 211 - 218 | 215 | 214 | 211 | 210 | 162 |
| New Hampshire | 214 - 219 | 217 | 217 | 215 | 213 | 55 |
| New Jersey | 222 - 224 | 223 | 223 | 223 | 223 | 474 |
| New Mexico | 209 - 215 | 212 | 211 | 207 | 208 | 94 |
| New York | 219 - 221 | 220 | 220 | 220 | 219 | 1089 |
| North Carolina | 216 - 220 | 218 | 218 | 217 | 217 | 518 |
| North Dakota | 209 - 213 | 210 | 210 | 207 | 209 | 28 |
| Ohio | 215 - 219 | 217 | 217 | 216 | 216 | 582 |
| Oklahoma | 209 - 215 | 212 | 211 | 208 | 211 | 214 |
| Oregon | 215 - 220 | 217 | 216 | 216 | 216 | 205 |
| Pennsylvania | 217 - 221 | 219 | 219 | 219 | 218 | 583 |
| Rhode Island | 213 - 220 | 217 | 217 | 215 | 216 | 50 |
| South Carolina | 210 - 217 | 215 | 214 | 209 | 213 | 234 |
| South Dakota | 209 - 214 | 211 | 208 | 209 | 212 | 41 |
| Tennessee | 215 - 219 | 218 | 217 | 217 | 215 | 319 |
| Texas | 218 - 221 | 220 | 219 | 219 | 219 | 1714 |
| Utah | 210 - 216 | 213 | 211 | 209 | 211 | 195 |
| Vermont | 211 - 217 | 215 | 215 | 212 | 213 | 33 |
| Virginia | 220 - 223 | 222 | 222 | 219 | 221 | 394 |
| Washington | 220 - 223 | 221 | 222 | 220 | 220 | 358 |
| West Virginia | 209 - 212 | 210 | 209 | 207 | 207 | 66 |
| Wisconsin | 213 - 217 | 215 | 214 | 213 | 213 | 289 |
| Wyoming | 209 - 213 | 211 | 209 | 207 | 207 | 24 |
| U.S. Territories | 209 - 211 | 210 | 208 | 207 | 207 | 45 |
| Studying Abroad | 222 - 224 | 223 | 223 | 223 | 223 | 112 |
| Commended | 209 - 211 | 210 | 208 | 207 | 207 |
If you’d like to see even more historical data, you can find cutoffs going back to 2008 in Compass’s National Merit Historical Cutoffs.
Why does each state have its own Semifinalist cutoff if the program is NATIONAL Merit?
This is always a hot button question. NMSC allocates the approximately 17,000 Semifinalists among states based on the annual number of high school graduates. That way, students across the nation are represented. It also means that there are very different qualifying standards from state to state. A Massachusetts student with a 220 might miss out on being a Semifinalist. If she lived 10 miles away in New Hampshire, she would qualify.
NMSC sets a target number of Semifinalists for a state. For example, California sees about 2,000 Semifinalists every year, Michigan 500, and Wyoming 25. In each state, NMSC determines the Selection Index that comes closest to matching its target number of Semifinalists. If 1,900 California students score 222 and higher and 2,050 score 221 or higher, then the Semifinalist cutoff would be 221 (this assumes that the target is exactly 2,000). Because score levels can get crowded, it is easy for cutoffs to move up or down a point even when there is minimal change in testing behavior or performance.
No Semifinalist cutoff can be lower than the national Commended level. Cutoffs for the District of Columbia and for U.S. students studying abroad are set at the highest state cutoff (typically New Jersey). The cutoff for students in U.S. territories and possessions falls at the Commended level each year. Boarding schools are grouped by region. The cutoff for a given region is the highest state cutoff within the region.
Why does the number of top scorers vary from year to year?
While there are changes in the number of students taking the PSAT/NMSQT, there can also be small flaws in test scaling that play a role. Prior to the digital PSAT, a single test form was seen by a large percentage of test takers. Something amiss with that single form could impact selection cutoffs across the country. The digital PSAT is constructed differently. Students receive unique form codes drawn from a large pool of problems. Scaled scores are generated based on the characteristics of those problems. In theory, this should make scores more stable. College Board’s early studies have found an extremely high correlation between the paper-and-pencil test and digital test. Still, even with its adaptive nature, the uncertainty remains as to whether the much shorter test can reliably score students at the 700-760 end of the scale.
What if I missed the PSAT because of illness or other legitimate reason?
You may still be able to enter the scholarship program by applying for Alternate Entry using an SAT score. Find information about last year’s process in Compass’s explanation of National Merit alternate entry.
When are National Merit Semifinalists announced?
The Commended cutoff becomes unofficially known by the end of April. The lists of Semifinalists are not distributed to high schools until the end of August. NMSC sets a press embargo on Semifinalist announcement until mid-September, but schools are allowed to notify students before that date. NMSC does not send Commended Student letters to high schools until mid-September. Compass will keep students updated on developments as those dates approach.
Do state and national percentiles indicate whether I will be a National Merit Semifinalist?
No! Approximately 1% of test takers qualify as Semifinalists each year, so it is tempting to view a 99th percentile score as indicating a high enough score — especially now that College Board provides students with percentiles by state. There are any number of flaws that rule out using percentiles as a quick way of determining National Merit status.
- Percentiles are based on section scores or total score, not Selection Index
- Percentiles are rounded. There is a large difference, from a National Merit perspective, between the top 0.51% and the top 1.49%
- Percentiles reveal the percentage of students at or below a certain score, but the “at” part is important when NMSC is determining cutoffs.
- The number of Semifinalists is based on the number of high school graduates in a state, not the number of PSAT takers. Percentiles are based on PSAT takers. States have widely varying participation rates.
- Most definitive of all: Percentiles do not reflect the current year’s scores! They are based on the prior 3 years’ performance. They are set even before the test is given. And if you are going to use prior history, why not use the completely accurate record of prior National Merit cutoffs rather than the highly suspect percentiles?
Entry requirements for National Merit versus qualifying for National Merit.
Your PSAT/NMSQT score report tells you whether you meet the eligibility requirements for the NMSP. In general, juniors taking the October PSAT are eligible. If you have an asterisk next to your Selection Index, it means that your answers to the entrance questions have made you ineligible. Your answers are conveniently noted on your score report. If you think there is an error, you will also find instructions on how to contact NMSC. Meeting the eligibility requirements simply means that your score will be considered. Approximately 1.4 million students enter the competition each year. Only about 53,000 students will be named as Commended Students, Semifinalists, Finalists, or Scholars. See National Merit Explained for more information.

Grandson 218 in Alabama got letter.
Congratulations to your grandson, Fay!
Thank you so much for this site!!
My son qualified in Arizona with a 219
I can confirm 214 in Mississippi. ☺
Thank you. Congratulations to your student!
Really? I got a 214 in MS, but I haven’t been told by my counselor yet. You’re really sure??
Oklahoma here – my daughter received notice today (to our surprise) and she scored a 214.
Congratulations to your daughter! Great to hear about another state seeing a lower cutoff.
Hey! I’m from Idaho and am a semifinalist. I got a 218
Congratulations, Sage! Thanks for the news.
Do you think a 222 will qualify in CT or do you think it will go up this year?
I don’t think it will go up this year, but I don’t mean that as “it definitely won’t go up.”
Hi Art!
What about Nevada? Do you think if the cut off will stay at 218? Any change it would go down 1 point? <=225 is really not helpful. haha That score will qualify you anywhere. Congrats to whoever got 225 though.
Chrissy,
We’re definitely seeing some downward movements, so there is hope. I haven’t heard anything yet beyond the 225 (I know. But I like to be completist).
WOOWHO!!!MY daughter (notified by high school counselor) has qualified in MA with a 223.
That should make the waiting worthwhile. Congratulations! One less state we have to worry about moving to 224. Now the question becomes whether it actually moved lower.
Just got word from my school in NY that i am a semifinalist. I had an index of 221.
James,
That’s great news for you and for many of your fellow New Yorkers. Congratulations.
Yes and thank you so much for this page!
My daughter received her letter today st school…218 Semifinalist in Alabama.
It’s great when schools get the information to students ASAP. Congratulations to your daughter!
214 made it in Oklahoma
Congratulations, Renee! Thanks for sending that along.
Hi Art,
What are the chances of a 221 qualifying as a semi finalist in NY?
According to the report I just got from another student, 100%.
👋🏻 Counselor told me today I’m a semifinalist in WV with a 216 but the cutoff is probably lower
Congratulations, Nick. You deserve your hard-earned emoji.
Hi Art,
I’m curious how you found out about NY’s cutoff— did someone report their score?
Thank you! (I’m an excited student.)
Yes, James got word from his school. The comment should now be visible near the bottom of the page, but our comment system is really glitchy.
Hi, Art. Any predictions on TN’s selection index staying at 219? Thanks for providing this service.
Stephen,
I like the fact that we’ve seen some cutoffs move down, but we don’t have enough states locked in to declare it a rout.
My student received notification from his school principal that he is a semifinalist in TN at 219.
Wonderful! I’ve updated the site.
NV =< 222 for the home schooler qualified.
Excellent! Thanks for sharing the news, AT.
Hey Art,
How do you know Florida’s cuttoff index is 219? I’m probably in denial because my index is 218, but is there any possibility that it is lower?
I was able to get confirmation from a source at a school. I think it’s accurate. Sorry to be the bearer of bad news.
Hi Art
Any news on Illinois? we may have a drop too? I’m anxiously waiting anyone’s reply if they found out Illinois is at 220 cutoff.
Nothing beyond the <=222.
Not much help, but a 224 made it in Missouri.
All information is helpful. Glad to hear that you got official confirmation. Congrats!
Hello Art, thanks for the great service. How do you know for sure the FL cutoff is 219 ? Were you able to corroborate with something official ?
Yes, I reserve “confirmed” for highly reliable sources.
Good deal, thanks much.
For Georgia, my 220 qualified, hope this helps!
It certainly does. I know some folks who were sitting at 220 and concerned. Congratulations!
Hi Art- any additional verification for Georgia? Sitting on a 220 and hoping!!
Nothing additional.
Got confirmation from GC today that she qualified with 220 in GA.
Congratulations! Thank you for sharing the report.
Where’s the PA updates?? I have twins with 223and 220 and are anxiously awaiting. Does pA education limit release?
Katie,
I’ve found that it’s unrelated to any state policies and just luck-of-the-draw based on individual schools and students. Only a certain percentage of students are comfortable reporting their status on a website. Only a certain percentage of schools release NMSF status before Sept 11. There just hasn’t been the right overlap in PA yet.
Just got a 220 confirmation from PA for son
I think PA is the largest state we hadn’t yet heard from, so I appreciate the report. Congratulations to your son!
Hello Art, I appreciate your work greatly. I’m in Ohio sitting at an index score of 219. What do you think the odds are the cutoff will drop? Thank you immensely for your input and for the work you put in here.
Habib,
We don’t have solid data from enough states to give accurate odds. All I can say is that I think the odds have gone up. Good luck!
We are in the same boat, Habib. My daughter has a 219 in Ohio and it’s hard to wait! I finally broke down and emailed her guidance counselors yesterday afternoon…hoping to hear back from them today, but not confident that they will tell me either way.
Art,
Is there still a chance that GA will drop to 219, or do you think that the cutoff is truly 220?
Kim,
There is still a chance. We don’t know enough to say what kind of chance.
Is there anything from NM that advises school counselors/principal not to tell students cutoff/status before the official press release?
Bob,
I forget the exact wording. There is not a prohibition against telling students, there is a request to not make public announcements. Since the press is notified of names on September 11 (although the information is published irregularly), it only makes sense to advise students before their names go public. It’s long been common practice to advise students to “wear a nice shirt for a picture” etc. Unfortunately, many schools don’t even notify students on the press release day. Students are left in limbo, since National Merit never officially releases cutoffs. My belief is that students are better served by making the cutoffs available.
In light of the the fact that National Merit never officially releases cutoffs, are you completely reliant on reports from students and counselors/schools about the final cutoffs for each state? Is there ever a situation in which you do not know by end of day on the press release date what the final cutoffs are for all the states? Does the press release include only names, or the associated scores as well? My older son was a semi-finalist several years ago, and we didn’t see anything in the paper about it until November 1st. My younger son is sitting on the bubble (we are in Montana) – we have our fingers crossed but no word from his counselor yet, so starting to get discouraged…
Kate,
We’ve managed to get absolutely confirmed figures for the last few classes, and I hope to do the same this year. If you find yourself in the situation of not hearing on 9/11, I would call NMSC. They won’t do any confirmations until after the release date. If you ask nicely, they’ll usually provide the cutoff, too. As you can imagine, they get swamped. The press release includes only names. There is a number next to names that always confuses folks. It’s simply a code for the likely major students listed during PSAT registration.
Thanks so much for the info! And wonderful blog you have – I have learned so much from you! 🙂
Thank you for the kind words, Kate.
221 in HI made the cutoff.
Congratulations, PD! Nice to hear from Hawaii.