Compass has now confirmed all of the National Merit Semifinalist cutoffs for the class of 2024. Eligible students who have a Selection Index at or above the cutoffs will be named Semifinalists. Students who miss the Semifinalist cutoff will be named Commended Students if they have Selection Indexes at or above 207. Students in the class of 2025 can jump here for thoughts on next year’s results.
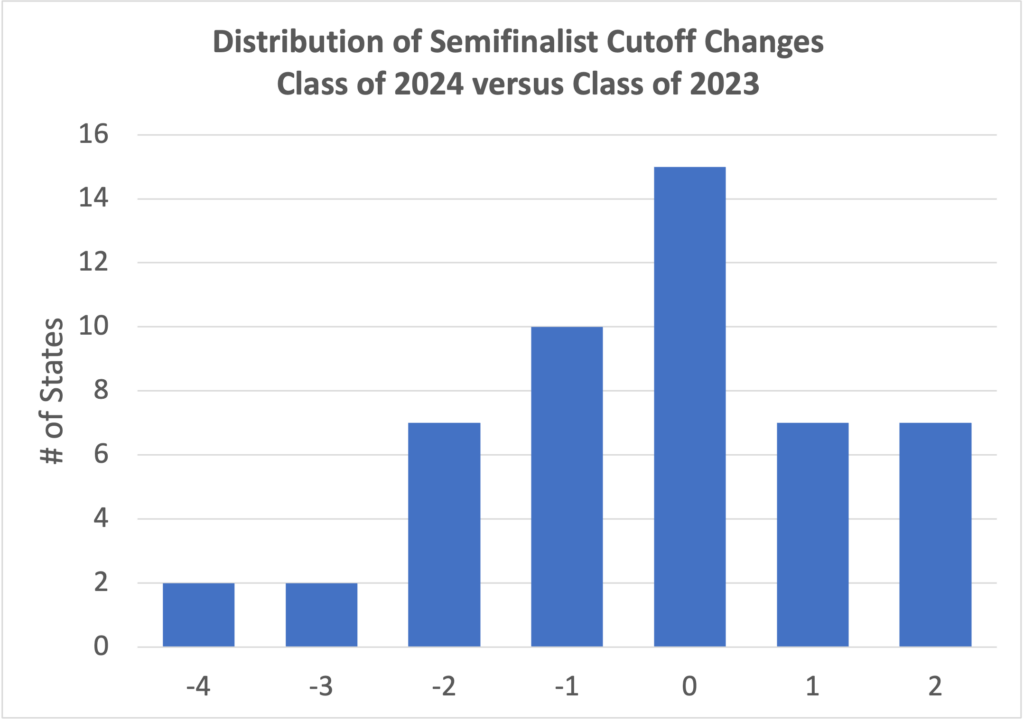
The PSAT was last overhauled in October 2015 (class of 2017). Twelve states set new cutoff lows for the class of 2024 versus the classes of 2017 to 2023. Not a single state reached a new high. Only 1 state, New Jersey, tied its 7-year high.
New Jersey also established the highest cutoff at 223 (which means that the District of Columbia and U.S. Students Abroad inherited that cutoff). Four states — New Mexico, North Dakota, West Virginia, and Wyoming — had cutoffs of 207. The five largest states saw no significant cutoff changes this year: California (221, +1), Texas (219, unchanged), New York (220, +1), Florida (216, unchanged), and Illinois (219, unchanged). The biggest changes were declines of 4 points in the South Carolina and Idaho cutoffs. Massachusetts, whose cutoff had been at 220 the last two years, made a surprising jump to 222.
State | Class of 2024 (Actual) | Class of 2023 (Actual) | Change |
|---|---|---|---|
| Alabama | 210 | 212 | -2 |
| Alaska | 209 | 210 | -1 |
| Arizona | 216 | 214 | 2 |
| Arkansas | 210 | 210 | 0 |
| California | 221 | 220 | 1 |
| Colorado | 216 | 217 | -1 |
| Connecticut | 221 | 221 | 0 |
| Delaware | 219 | 218 | 1 |
| District of Columbia | 223 | 223 | 0 |
| Florida | 216 | 216 | 0 |
| Georgia | 217 | 218 | -1 |
| Hawaii | 217 | 215 | 2 |
| Idaho | 211 | 215 | -4 |
| Illinois | 219 | 219 | 0 |
| Indiana | 216 | 214 | 2 |
| Iowa | 210 | 212 | -2 |
| Kansas | 214 | 214 | 0 |
| Kentucky | 211 | 212 | -1 |
| Louisiana | 214 | 213 | 1 |
| Maine | 213 | 215 | -2 |
| Maryland | 221 | 222 | -1 |
| Massachusetts | 222 | 220 | 2 |
| Michigan | 217 | 218 | -1 |
| Minnesota | 216 | 216 | 0 |
| Mississippi | 209 | 210 | -1 |
| Missouri | 214 | 213 | 1 |
| Montana | 209 | 207 | 2 |
| Nebraska | 210 | 212 | -2 |
| Nevada | 211 | 210 | 1 |
| New Hampshire | 215 | 213 | 2 |
| New Jersey | 223 | 223 | 0 |
| New Mexico | 207 | 208 | -1 |
| New York | 220 | 219 | 1 |
| North Carolina | 217 | 217 | 0 |
| North Dakota | 207 | 209 | -2 |
| Ohio | 216 | 216 | 0 |
| Oklahoma | 208 | 211 | -3 |
| Oregon | 216 | 216 | 0 |
| Pennsylvania | 219 | 218 | 1 |
| Rhode Island | 215 | 216 | -1 |
| South Carolina | 209 | 213 | -4 |
| South Dakota | 209 | 212 | -3 |
| Tennessee | 217 | 215 | 2 |
| Texas | 219 | 219 | 0 |
| Utah | 209 | 211 | -2 |
| Vermont | 212 | 213 | -1 |
| Virginia | 219 | 221 | -2 |
| Washington | 220 | 220 | 0 |
| West Virginia | 207 | 207 | 0 |
| Wisconsin | 213 | 213 | 0 |
| Wyoming | 207 | 207 | 0 |
| U.S. Territories | 207 | 207 | 0 |
| Studying Abroad | 223 | 223 | 0 |
| Commended | 207 | 207 | 0 |
Compass is not affiliated in any way with the National Merit Scholarship Program or College Board. Students will be officially notified by their high schools and receive information about the next step in the National Merit process. Compass has more information about that process in the National Merit FAQ. Some schools do not release Semifinalist information to students until after the press release date of September 13th. National Merit Scholarship Corporation (NMSC) will not confirm students’ qualification status until after that date. Commended letters are not mailed to schools until September 13th.
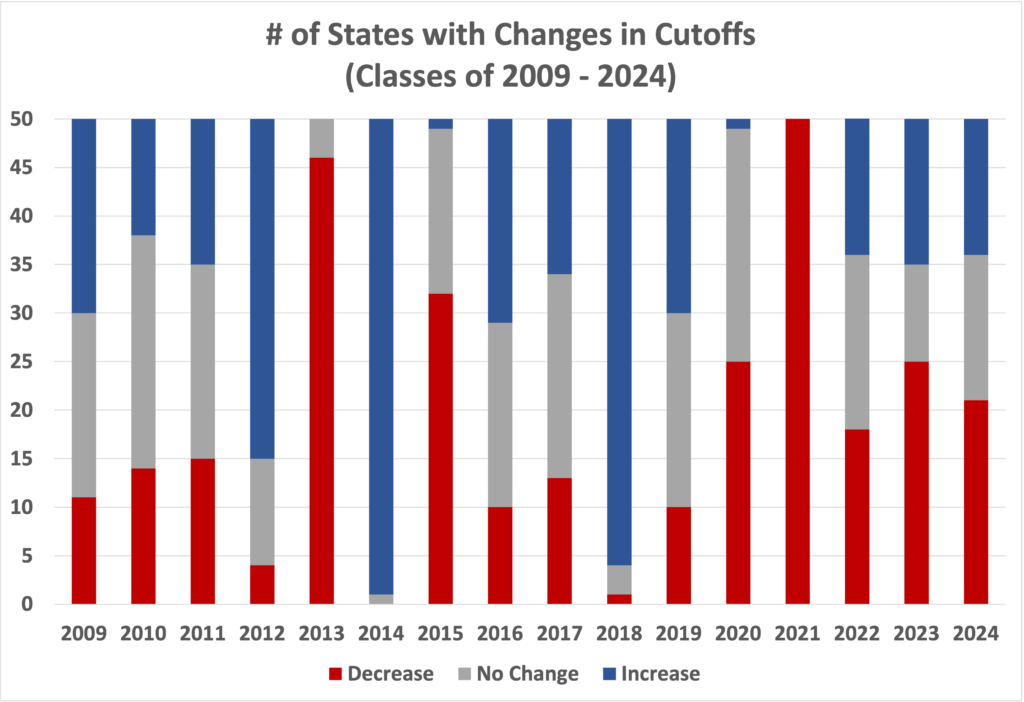
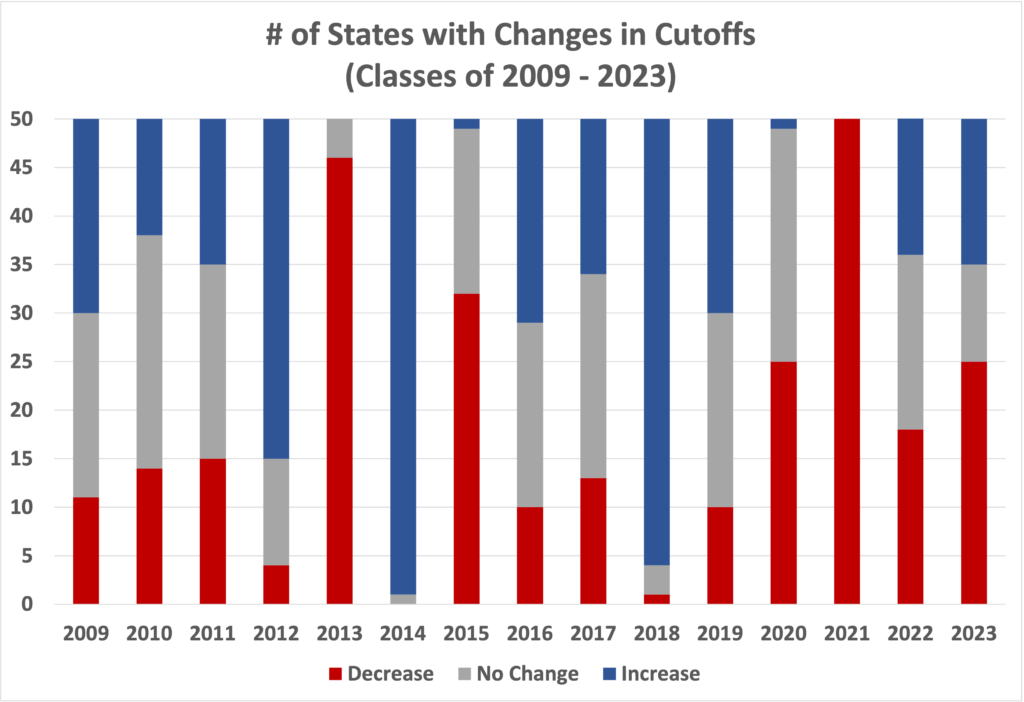
While “no change” was the most common result, it was only true in 15 states. 21 states saw declines. 14 states saw higher cutoffs. Compass has maintained data on National Merit cutoffs since the class of 2009, and this year was close to the overall average of 18 cutoffs per year going down, 18 going up, and 14 remaining unchanged.
Expectations for the class of 2025
Class of 2025 students taking the PSAT this fall can use the information for guidance but should not expect stable cutoffs for next year. Even in what was mostly a level year, 70% of cutoffs changed for the class of 2024. The introduction of the digital PSAT in October 2023 is likely to mean wider than usual swings. It’s not clear, for example, whether the digital test will prove more or less popular than the paper-and-pencil test that it is replacing. Also, College Board does not always have new exams “dialed in” during initial administrations. Compass will provide updates once more score information is available in November and December. The table below shows the highs and lows seen for each state since the class of 2017 (when the PSAT was last overhauled). New Jersey’s cutoff, for example, has remained at 222 or 223 during the entire period, but 18 states have seen score differences of at least 6 points within the last 8 years. See Compass’s National Merit Historical Cutoffs for data going back to the class of 2008.
| State | Class of 2024 | 8-Yr Min | 8-Yr Max | 8-Yr Avg | Range |
|---|---|---|---|---|---|
| Alabama | 210 | 210 | 216 | 214 | 6 |
| Alaska | 209 | 208 | 217 | 212 | 9 |
| Arizona | 216 | 214 | 220 | 218 | 6 |
| Arkansas | 210 | 210 | 215 | 212 | 5 |
| California | 221 | 220 | 223 | 221 | 3 |
| Colorado | 216 | 216 | 221 | 218 | 5 |
| Connecticut | 221 | 220 | 222 | 221 | 2 |
| Delaware | 219 | 218 | 222 | 220 | 4 |
| District of Columbia | 223 | 222 | 224 | 223 | 2 |
| Florida | 216 | 216 | 219 | 217 | 3 |
| Georgia | 217 | 217 | 220 | 219 | 3 |
| Hawaii | 217 | 215 | 220 | 218 | 5 |
| Idaho | 211 | 211 | 216 | 214 | 5 |
| Illinois | 219 | 218 | 221 | 220 | 3 |
| Indiana | 216 | 214 | 219 | 217 | 5 |
| Iowa | 210 | 210 | 216 | 213 | 6 |
| Kansas | 214 | 214 | 219 | 216 | 5 |
| Kentucky | 211 | 211 | 218 | 215 | 7 |
| Louisiana | 214 | 212 | 217 | 214 | 5 |
| Maine | 213 | 211 | 217 | 214 | 6 |
| Maryland | 221 | 221 | 224 | 222 | 3 |
| Massachusetts | 222 | 220 | 223 | 222 | 3 |
| Michigan | 217 | 216 | 219 | 218 | 3 |
| Minnesota | 216 | 216 | 220 | 218 | 4 |
| Mississippi | 209 | 209 | 215 | 212 | 6 |
| Missouri | 214 | 213 | 217 | 215 | 4 |
| Montana | 209 | 207 | 214 | 211 | 7 |
| Nebraska | 210 | 210 | 216 | 213 | 6 |
| Nevada | 211 | 210 | 218 | 215 | 8 |
| New Hampshire | 215 | 213 | 219 | 216 | 6 |
| New Jersey | 223 | 222 | 223 | 223 | 1 |
| New Mexico | 207 | 207 | 215 | 212 | 8 |
| New York | 220 | 219 | 221 | 220 | 2 |
| North Carolina | 217 | 217 | 220 | 218 | 3 |
| North Dakota | 207 | 207 | 212 | 210 | 5 |
| Ohio | 216 | 215 | 219 | 217 | 4 |
| Oklahoma | 208 | 208 | 216 | 212 | 8 |
| Oregon | 216 | 216 | 221 | 219 | 5 |
| Pennsylvania | 219 | 217 | 220 | 219 | 3 |
| Rhode Island | 215 | 213 | 220 | 216 | 7 |
| South Carolina | 209 | 209 | 217 | 214 | 8 |
| South Dakota | 209 | 209 | 215 | 212 | 6 |
| Tennessee | 217 | 215 | 219 | 217 | 4 |
| Texas | 219 | 219 | 221 | 220 | 2 |
| Utah | 209 | 209 | 216 | 213 | 7 |
| Vermont | 212 | 211 | 217 | 214 | 6 |
| Virginia | 219 | 219 | 222 | 221 | 3 |
| Washington | 220 | 220 | 222 | 221 | 2 |
| West Virginia | 207 | 207 | 212 | 209 | 5 |
| Wisconsin | 213 | 213 | 217 | 215 | 4 |
| Wyoming | 207 | 207 | 213 | 210 | 6 |
| Territories | 207 | 207 | 212 | 209 | 5 |
| Outside US | 223 | 222 | 224 | 223 | 2 |
| Commended | 207 | 207 | 212 | 209 | 5 |
The information below is preserved as a record of how we got from the October 2022 PSAT to the September 2023 Semifinalist announcement, and includes original research on historical trends and the data Compass uses to estimate future cutoffs.
September 7, 2023
Cutoffs in Alaska (209), Arkansas (210), Iowa (210), Idaho (211), Kentucky (211), and South Dakota (209) are now confirmed. That should be all 50 states, DC, U.S. territories, and U.S. students studying abroad! See the full list below.
September 7, 2023
Cutoffs in Kansas (214), Montana (209), Alabama (210), and Indiana (216) are now confirmed. Iowa’s cutoff is less than or equal to 211.
September 6, 2023
Cutoffs in Nevada (211), Michigan (217), Missouri (214), North Carolina (217), and Minnesota (216) are now confirmed. Also confirmed are South Carolina (209), Rhode Island (215), and Oregon (216). Alaska’s cutoff is no higher than 210. Vermont’s is no higher than 213.
September 5, 2023
A student has qualified with a 218 in Minnesota, so that information has been added below. Georgia’s cutoff is now confirmed at 217. We also have confirmation on Colorado, Delaware, Hawaii, and New Hampshire. Kentucky’s cutoff is ≤ 211. And a commenter pointed out that I had referred to the Louisiana cutoff without updating the list. Updated Washington to reflect a confirmation of 220. DC’s cutoff will be 223 based on New Jersey. Kansas student qualifying at 219. Updated list below with previously confirmed Wisconsin.
September 4, 2023
Ohio, Oklahoma, Maine, North Carolina, and Pennsylvania are all confirmed. Report of 218 qualifying in Georgia, so it is now ≤ 218. Report of 211 qualifying in Alabama and 210 in Arkansas.
September 2, 2023
Travel day today, so I’ve been slow in the comments. We’ve now got the 5 largest states — CA, TX, NY, FL, and IL — confirmed. Also confirmed are 4 states at the other end of the scale. New Mexico, North Dakota, West Virginia, and Wyoming will all come in with a 207 cutoff. Report of a 215 qualifier in Maine. And Mississippi’s final number is 209.
September 1, 2023
Starting off the day with a report of Nebraska’s cutoff at 210 and a student in CA qualifying at 221. We’ve received word that New Jersey’s cutoff is 223. This is almost certainly the highest cutoff in the U.S. this year, so it will also define the cutoff for DC and U.S. Students Abroad. Utah has been confirmed at 209. A student in North Carolina qualified at 218, so the NC cutoff will be no higher than 218. Virginia’s cutoff has a surprise drop to 219. Connecticut is confirmed at 221. A student in Michigan qualified with a 218. Washington state’s cutoff is 220 or lower. South Carolina’s cutoff has fallen and is no higher than 210. Tennessee is confirmed at 217. A Colorado student qualified at 217. Oklahoma updated.
August 31, 2023
Arizona is now confirmed as a cutoff of 216. A Virginia student qualified with a 221, so the cutoff is 221 or lower. Tennessee’s cutoff will be moving higher this year. A 216 did not qualify. Texas will be no higher than 219 (it looks like a 218 did not qualify). A Redditor has reported that Mississippi is at 209 or 210. Also new reports on Oklahoma, Ohio, Georgia, and New York.
August 30, 2023
A couple of reports out of California and Ohio may make some students breath a sigh of relief. We still don’t know the minimum qualifying scores in those states.
August 28, 2023: Florida‘s cutoff is official at 216.
NMSC mailed Semifinalist letters to high schools last week. It often takes time for the announcements to show up on principals’ desks and even longer for notices to be passed along to students. It’s not unusual for students to wait until well into September. In the meantime, Compass will report information as we hear it.
If you receive news — good or bad — we would like to incorporate it. The comments below are moderated, so you can ask that we not use your name. Your email address will not be shared.
Alaska = 209
Delaware = 219
District of Columbia = 223
Illinois = 219
New Jersey = 223
New Mexico = 207
North Carolina = 217
Oregon = 216
Rhode Island = 215
Texas = 219
Washington = 220
West Virginia = 207
= indicates that the state’s cutoff is known
≤ indicates that the cutoff is equal to or lower than the given Selection Index
> indicates that the cutoff is higher than the given Selection Index
April 14, 2023 Update
Compass has confirmed that the Commended cutoff for the class of 2024 is a Selection Index of 207. Commended Students will not be notified by their schools until mid-September, but every eligible junior at 207 or above will be either a Commended Student or a Semifinalist. Based on the initial PSAT performance data analyzed in December, Compass had predicted a 207 Commended level. This means that our Most Likely estimates for state Semifinalist cutoffs will remain unchanged. It does mean that the upper ends of the ranges (or scores above the ranges) are far less likely than if the Commended cutoff had gone up. The next significant release of information will not come until the end of August, when NMSC mails Semifinalist letters to schools.
Compass has analyzed the October 2022 PSAT/NMSQT results to see how scores will impact the class of 2024’s National Merit hopes. Almost 1.5 million juniors took the qualifying exam for the National Merit Scholarship Program, and more than 54,000 of them will receive some form of honors or scholarships.
The Continued Drop-Off in High-Scorers
Students compete for National Merit honors. The more competitive the class, the higher the qualifying scores required (“cutoffs”). How well did students do this year?
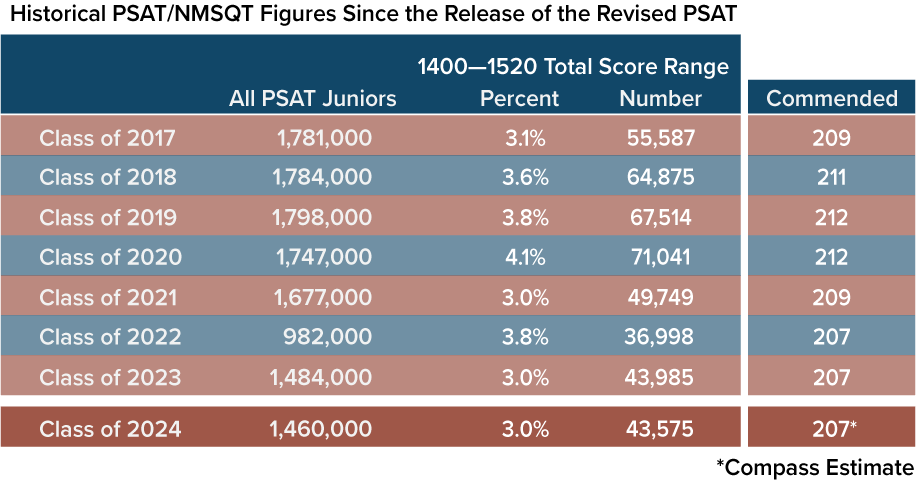
In the class of 2020, more than 70,000 students scored above 1400 on the PSAT. This year the figure is under 45,000. This year looks surprisingly similar to last year. Test taker volume is still off more than 13% from pre-pandemic levels, and only 3% of those testers achieved a top score. The results in the last two years may reflect pandemic-related learning losses. Alternatively, College Board has scaled recent PSATs more unfavorably than in the past.
What is a Selection Index and why does it matter?
Instead of using PSAT scores directly, NMSC calculates a Selection Index (SI) that can be found with the online PSAT report. [For a general overview, including information on the Selection Index and the various stages of the selection process, see our National Merit FAQ.] A student scoring 720 ERW and 680 Math has an SI of 212. A student scoring 680 ERW and 720 Math has an SI of 208. On average, students scoring 1400 and above have Selection Indexes of 210 and above. That information allows us to estimate where the Commended level will fall based on how many students receive scores of 1400 or higher.
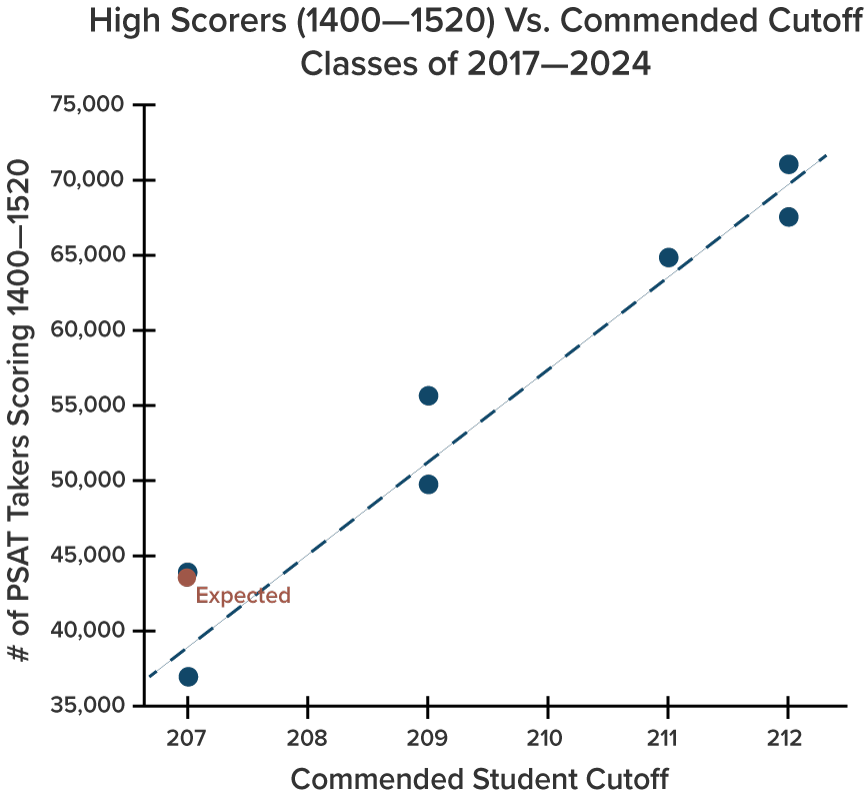
Years in which a large number of students achieved high scores are associated with Commended cutoffs above 210. Years in which fewer than 60,000 students got top marks are associated with Commended cutoffs below 210. Compass expects this year’s Commended cutoff to fall somewhere between 206 and 209, with a 207 being the “most likely.”
Commended versus Semifinalist, national versus state
The relationship between nationwide performance and Semifinalist cutoffs is more complex. The Commended cutoff is determined by looking at the top 50,000 scorers nationally. Semifinalist cutoffs, on the other hand, are determined state-by-state. The performance of students in Georgia or Michigan has no impact on the cutoffs in New York or Ohio. NMSC establishes a target number of Semifinalists based on the high school population in each state. California, for example, has a target of approximately 2,000 Semifinalists. NMSC determines the Semifinalist cutoff that comes as close as possible to producing 2,000 Semifinalists in the state. While this methodology ensures a national distribution of Semifinalists, it means that some states are far more competitive than others. The table below provides Compass’s estimates for Semifinalist cutoffs.
[*See table at the top of the post for actual values as of September 2023.]
Consider the range
State cutoffs fluctuate from year to year — even when the Commended cutoff is unchanged! Rather than expecting that a single score is the correct estimate, Compass recommends that students consider the possibility that a state’s cutoff will fall within the estimated range. Over the last ten years, only 27% of Semifinalist cutoffs have remain unchanged from one year to the next. [Compass’s historical archive of National Merit cutoffs dating back to 2008 can be found here.]
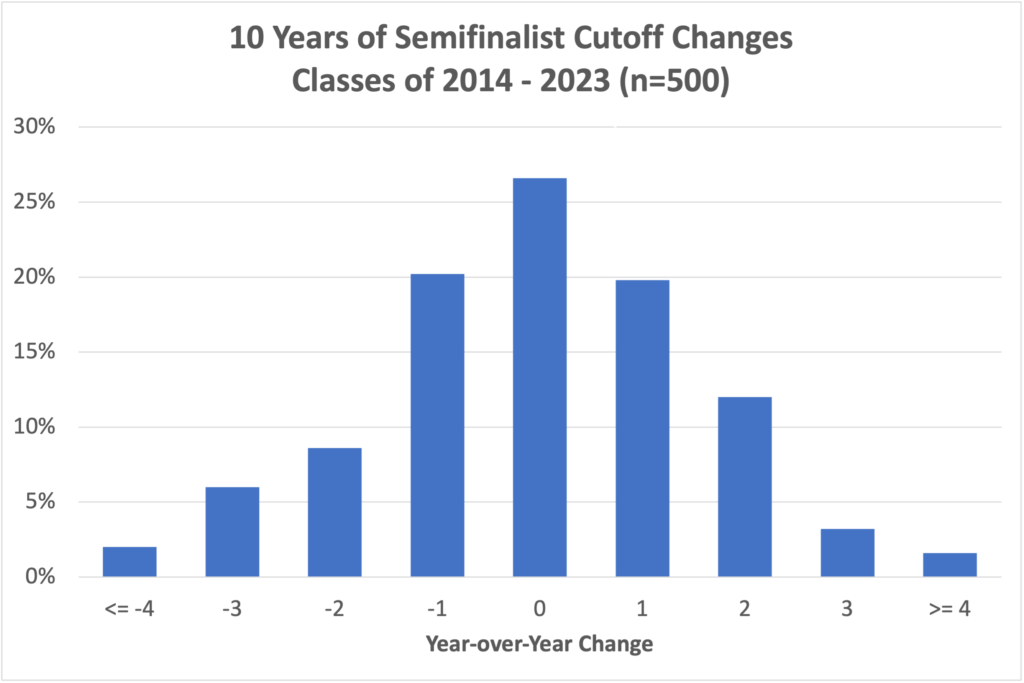
Compass projects this year to be more stable than most because of the similar national performance compared to the class of 2023. However, in Compass’s 15-year database, there has never been a year when the majority of state cutoffs remained the same. So while “no change” is usually the best bet one can make, it’s also a bad bet. Consider, instead, the estimated range.
Small shifts can matter
It doesn’t always require a large change in testing behavior to cause a state’s cutoff to move. NMSC has no way of making fine distinctions within a state. Everyone at a given score is either a Semifinalist or not. The organization tries to come as close as possible in meeting the state’s allocation of Semifinalists (a number it does not directly report), but the nature of the Selection Index means that small variations can move a cutoff higher or lower.
Let’s assume that the target number of Semifinalists for a state is 300. If 282 students had Selection Indexes of 220 or higher and 315 scored 219 or higher, then 219 comes closest to meeting the target and will be set as the cutoff. If only 5 students at 219 had gotten 1 additional question right, there would have been 287 students at 220 or higher, and a 220 cutoff would have been chosen by NMSC. Small differences in class makeup, test form difficulty, or a few extra students guessing correctly on a problem can move the Semifinalist cutoff by a point.
When your selection unit is not a state
The Semifinalist cutoff for each of the 50 states is calculated independently. However, some cutoffs are not independent. NMSC considers boarding school students, students studying abroad, and students in the District of Columbia and in U.S. Territories or Commonwealths as separate “selection units” that follow specific rules. The net effect is that the cutoffs for the District of Columbia and students studying abroad are always set at the level of the highest state cutoff. The cutoff for U.S. Territories is set at the Commended Student level (as it is with some states). The cutoff for a boarding school is set at the highest state cutoff within the boarding school’s region.
The role of test scaling
The PSAT is usually taken by about 1.5 million students each year. The pool is (or was) large enough and consistent enough that the scores of the top 50,000 students should not change much. And yet they do. This reflects a shortcoming of the PSAT/NMSQT — it’s well-designed to measure the performance of the average student, but is more prone to error at the edges. College Board attempts to scale each PSAT so that a particular score represents the same level of achievement. In practice, we see clear examples of where College Board’s numbers are “off.” The class of 2021, for example, had an unusual test form that produced far lower cutoffs than in the previous year. Further confusing matters is that several different test forms are used each year. Compass’s analysis shows that this year’s PSAT — or at least the primary form, taken by more than 1 million students — was difficult. This difficulty can show up throughout the range of cutoffs, but lower scoring states tend to track the Commended level more than do the higher scoring states.
Updates and comments
Compass will update this post as new developments arise. We try to (eventually) answer all questions in the comments, but please be aware that comments are moderated and will not display until approved.

