Each year, Compass updates our SAT and ACT Policies and Score Ranges for Popular Colleges and Universities with the testing profile of the new entering class. Referencing a school’s 25th – 75th percentile SAT and ACT ranges (“middle 50 percent”) offers prospective applicants a quick way to assess the degree to which their scores blend in with those of admitted students.
Pre-pandemic, most of the schools that we tracked required scores, forcing students to submit their ACTs or SATs regardless of where they landed in relation to a school’s range. With over 95% of four-year colleges and universities suspending their testing requirement, Class of 2021 students who hoped to apply with test scores faced an extra decision: whether or not to submit their scores. Sometimes, the decision was relatively straightforward—say, scores that fell in a school’s top quartile (include) or bottom quartile (omit). Many times, it was not. Students had to aim scores obtained in severely compromised circumstances across a field of nuanced policy-speak to hit moving score range targets. And even though most schools reassured applicants with a familiar refrain—”you will not be disadvantaged for omitting scores”—how much consideration would colleges still give to testing?
Certain schools have now shared some Class of 2021 testing data, offering a glimpse into the role test scores played in admission outcomes. While far from an exhaustive list, the data calls into question the sincerity of some testing non-required policies and how students perceive them.
| School | TO Policy Applies to Class Year(s) | Type | Percent of Applicants: Test Submitters | Percent of Admitted Class: Test Submitters | Admit Rate: Test Non-Submitters | Admit Rate: Test Submitters | Admit Rate Advantage: Test Submitters |
|---|---|---|---|---|---|---|---|
| Amherst | 2021, 2022, 2023 | Early and Regular | 51% | 63% | 6% | 9% | 1.5 |
| Barnard | 2021, 2022, 2023 | Early and Regular | 41% | 53% | 8% | 13% | 1.6 |
| Boston College | 2021, 2022 | Early and Regular | Not released | 61% | Not released | Not released | N/A |
| Boston University | 2021, 2022 | Early and Regular | 42% | 57% | 14% | 25% | 1.8 |
| Colgate | 2021, 2022, 2023 | Early and Regular | 41% | 60% | 12% | 25% | 2.2 |
| Davidson | 2021, 2022, 2023 | Early and Regular | 50% | 66% | 11% | 23% | 2.0 |
| Duke | 2021, 2022 | Early and Regular | 56% | Not released | Not released | Not released | N/A |
| Emory | 2021, 2022 | Early and Regular | 50% | 69% | 13% | 28% | 2.2 |
| Georgia Tech | 2021 | Early and Regular | 63% | 79% | 10% | 23% | 2.3 |
| Georgetown | 2021 | Early and Regular | 81% | 89% | 4% | 7% | 1.9 |
| Northeastern | 2021, 2022 | Early | 33% | 33% | 53% | 53% | 1.0 (No Advantage) |
| Notre Dame | 2021, 2022, 2023 | Early and Regular | 51% | 66% | 10% | 19% | 1.9 |
| Penn* | 2021, 2022 | Early and Regular | 61% | 75% | 4% | 7% | 1.8 |
| Pomona | 2021, 2022, 2023, 2024 | Early and Regular | Not released | 57% | Not released | Not released | N/A |
| Rice | 2021, 2022 | Early and Regular | Not released | 80% | Not released | Not released | N/A |
| Swarthmore | 2021, 2022 | Early | 51% | 53% | 23% | 25% | 1.1 |
| Tufts | 2021, 2022, 2023 | Early and Regular | 50% | 60% | 9% | 13% | 1.5 |
| Tulane | 2021, 2022 | Early and Regular | 60% | Not released | Not released | Not released | N/A |
| University of Georgia | 2021 | Early and Regular | 50% | 59% | 32% | 46% | 1.4 |
| University of Virginia | 2021, 2022, 2023 | Early and Regular | 58% | 72% | 14% | 26% | 1.9 |
| USC | 2021, 2022, 2023 | Early and Regular | 49% | 55% | 11% | 14% | 1.3 |
| Vanderbilt | 2021, 2022 | Early and Regular | 56% | 61% | 6% | 7% | 1.2 |
| Villanova | 2021, 2022 | Early and Regular | Not released | 56% | Not released | Not released | N/A |
| Wash U | 2021, 2022 | Early and Regular | 59% | Not released | Not released | Not released | N/A |
| Wellesley | 2021, 2022 | Early and Regular | 40% | 51% | 13% | 20% | 1.6 |
*Estimate using Early Decision data
Making Sense of the Data
In the Class of 2021 Admit Rates figure, schools with similar admit rates between test submitters and test non-submitters, such as Vanderbilt, Wellesley, and Northeastern (EA), back the spirit of test optionality—that students without scores will not be disadvantaged—with their admissions data. Schools with divergent admit rates between submitters and non-submitters (Davidson, Georgia Tech, and Georgetown) are more likely to favor applicants with test scores.
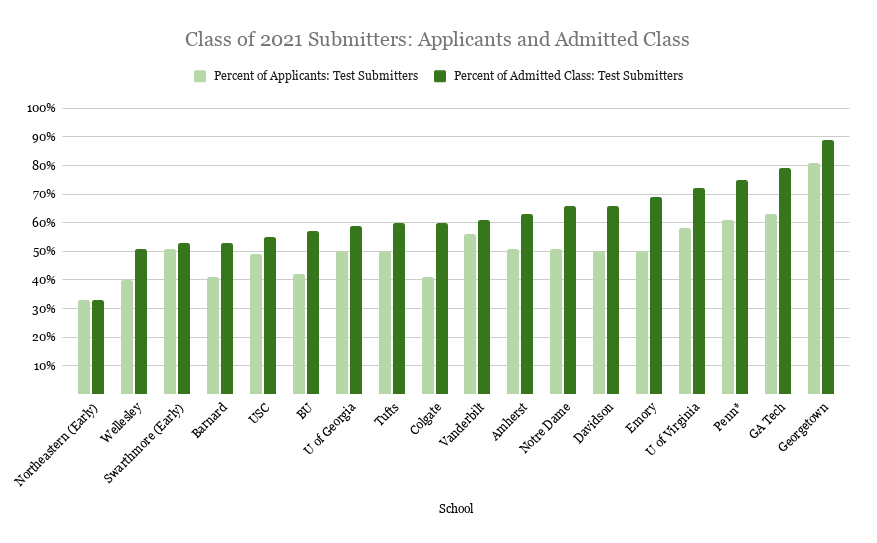
In the Class of 2021 Submitters figure, schools whose admitted class profiles hover close to an even 50/50 split between submitters and non-submitters (Wellesley, Barnard, or USC) also back the spirit of test optionality. Schools who admitted far more students with scores than without, such as Penn (75% of admitted students were test submitters) or Georgetown (89% of admitted students were test submitters) are more likely to favor applicants with test scores. We suspect these schools are also more likely to require testing again once ACT and SAT sites are widely available.
In discussing Georgetown’s intention to require testing for Class of 2022 applicants, Charles Deacon, Dean of Admissions, said, “We will continue to allow applicants who are not able to access the SAT or ACT due to [COVID-19] to apply without the test but it is our expectation that vaccines will be readily available by this summer and we expect that most applicants should be able to fulfill the testing requirement by next fall” (GU Admits Just 12% of Applicants, Setting Record Low).
We suspect that test submitter pools are overrepresented by high-scoring test-takers who peaked early. These students were most likely to secure competitive scores before the pandemic eliminated site availability in March 2020. Test submitters were likely far along academically: many had already taken Algebra 2 (or an equivalent class) in 9th or 10th grade, equipping them to tackle the SAT’s Passport to Advanced Math questions, or the ACT’s questions on logarithms, imaginary numbers, and matrices. Consequently, we suspect a high correlation between the presence of scores and academic rigor. In many cases, scores likely served as confirmation of students’ strong academic profiles as demonstrated by course rigor and grades.
Students who had hoped to take exams during the most popular window—spring of 11th grade—had to contend with cancellations and, consequently, were less likely to share scores in the 2020-21 application cycle. Ongoing cancellations during the most popular spring testing window was unfortunate but very likely an anomaly that will not be repeated for the Class of 2022 and beyond.
What Happened to Score Ranges?
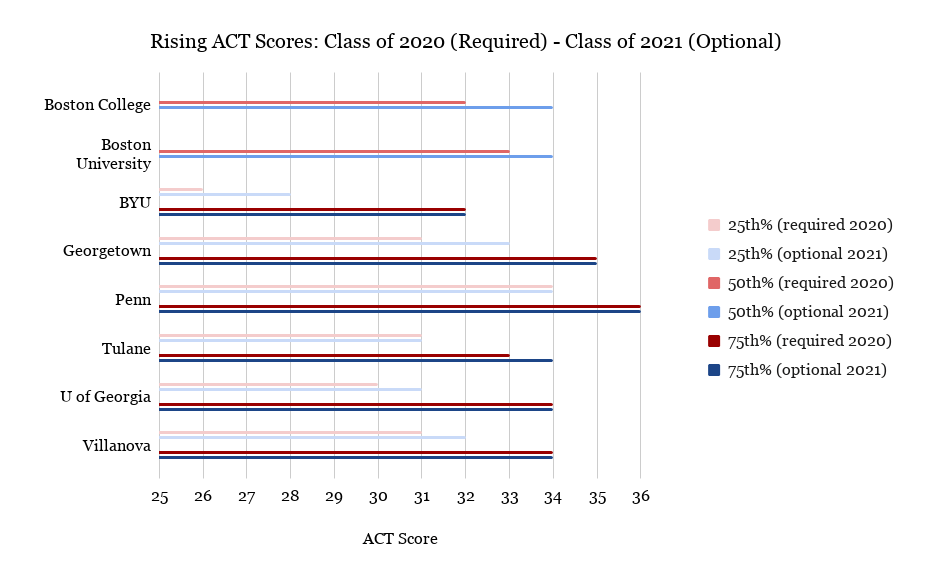
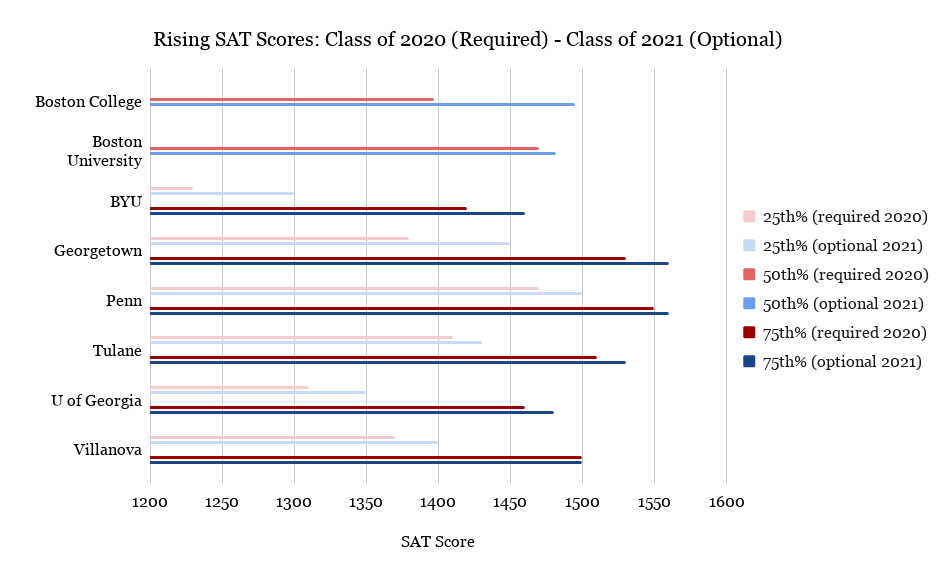
At selective institutions, they went up. Although most colleges have not yet reported Class of 2021 score ranges—and, in some cases, do not plan to—selective schools who have reported score ranges indicate year-over-year rises. This is mostly due to high-scoring admits self-selecting into submitting scores, and softer-scoring admits electing not to submit scores.


Note in the Rising SAT Scores figure the nearly 100 point increase in Boston College’s average SAT score! BC’s average admitted student SAT went from 1397 for the Class of 2020 (Test Required) to 1495 for the Class of 2021 (Test Optional).
How are Colleges Reporting Scores?
When requiring testing, schools report annual data on their admitted class’s middle 50 percent ACT and SAT scores. In temporarily suspending the testing requirement, many schools are changing what score data they’re electing to report.
Full testing profile:
Georgetown, Penn, and the University of Georgia are among schools who shared a middle 50 percent profile of test submitters.
Unsurprisingly, their middle 50 percent indicates that scores submitted by admitted students were on par with or higher than those of previous years, as students with strong scores self-selected into submitting them. Penn’s admitted student 25th – 75th percentile SAT range increased from a 1470 – 1550 for the Class of 2020 (Test Required) to a 1500 – 1560 for the Class of 2021 (Test Optional).
We suspect that schools who shared score ranges similar to or higher than ranges of prior years are among the schools most likely to return to Test Required policies. In May 2021, Georgia public schools announced that they will follow the lead of Florida publics, requiring tests for the Class of 2022 and beyond.
Suspended testing profile:
Other schools will not share their testing profiles for the Class of 2021. Motives include deemphasizing scores and prioritizing other elements of the application. This is especially important for underrepresented students in higher education, such as students of color, first generation students, and students from low-income backgrounds who historically underperform on standardized tests relative to academic performance in college.
Motives also include reducing demands on students. According to Lee Coffin, Vice Provost for Enrollment and Dean of Admissions and Financial Aid at Dartmouth, “Dartmouth will not report a testing profile for the [Class of 2021] to the campus or national media nor will we share one in our publications or on our website. If the goal is to ‘reduce anxiety for students,’ let’s reduce the spotlight on testing during these uncertain times.”
In specifying a reduced spotlight during “these uncertain times,” Dartmouth’s language leaves the door open for a return to requiring scores and sharing testing profiles.
Modified testing profile:
In deciding what testing data to share with future applicants, Andy Borst, Director of Undergraduate Admissions at the University of Illinois, polled Twitter: “Does sharing [Class of 2025 score ranges] add clarity or do too much to discourage [future] students from applying?”
The influx of applications seen by selective institutions that temporarily suspended their testing requirements indicates that many students self-select out of applying when their test scores do not blend in, particularly when scores are required. With 56% of UIUC’s admitted Class of 2021 students electing to submit scores, the school likely saw its middle 50 percent rise.
In its First-Year Class Profile, UIUC decided to average the past three years of score data, grouping the high school graduating Classes of 2019 and 2020 (Test Required) with the Class of 2021 (Test Optional).
Takeaways for the Classes of 2022, 2023, and Beyond
Although some schools will likely return to Test Required policies once ACT and SAT sites are more widely available, the Classes of 2022, 2023, and beyond will face a testing policy landscape populated by more flexible testing policies than did students who applied pre-pandemic. Unless students in upcoming classes are applying exclusively to Test Required or Test Free schools, most students should expect to navigate the decisions around whether to submit their scores.
Data from the Class of 2021 is one of many factors students should consider when determining whether or not to submit their scores. Mere presence or absence of a test score says little of the value of the score. Just because a college admits more students with test scores does not mean that sharing any score will confer an advantage.
Other factors include the holistic aspects of your application, your scores relative to your opportunities, our guidance on how the weight given to test scores correlates with institutional selectivity, any “extra hoops” you must jump through if you apply without scores—some schools require an interview or supplemental essay—and the specifics of a policy (“a temporary suspension of a testing requirement” versus a “a three-year Test Optional trial period”).
If you’re unsure about whether or not to submit scores, try calling the school itself. During a recent Compass webinar, College Admission and Testing: What Just Happened and What’s Next?, Mari Prauer, Senior Assistant Dean of Admission at Colgate University, said, “My biggest piece of advice is to reach out to us… We’re here to help. If there’s anything we can do to shed insight on what’s going on in [college admissions officers’] minds, we love to do that.” Andy Borst at the University of Illinois agrees: “If you’re struggling to decide whether you want your test scores to be considered, I encourage you to call us. Our admissions counselors can give you helpful guidance based on your situation” (UIUC Test-Optional Policy Extended).
Contact a Compass Director
By the time they’re seniors, students in the Class of 2022, Class of 2023, and beyond who build their academic and test-taking expertise will face plenty of encouraging college options, to which they can choose to submit or not to submit their scores. If you are not yet working with us, contact a Compass director for a complimentary consultation. We appreciate the opportunity to learn how we can best tailor expert guidance, proctored practice testing opportunities, and 1-on-1 tutoring support to you in your ACT, PSAT, SAT, AP, and academic goals.


Great article. One thing I would take issue with is this line: ” Ongoing cancellations during the most popular spring testing window was unfortunate but very likely an anomaly that will not be repeated for the Class of 2022 and beyond. ” The vast majority of my students have been cancelled at least once this spring and several have been unable to test. One was just cancelled yesterday from her second June ACT school, after the first one cancelled some time ago. Others are on standby for this weekend. There are virtually no options for July within reasonable driving distance.
You’re right on the money, Patti. For our families in places like Southern California or the Seattle metro area, test sites through this summer are a crapshoot. Other areas like South Florida and Philly have greater availability. We should have specified that on a broader, national level, things are looking more favorable. But there are clearly some major exceptions.