
Teaching a student how to make educated guesses on multiple choice questions is SAT Tutoring 101. For graduate-level SAT tutoring, it is more interesting to examine the smartest way to handle multiple choice’s eccentric cousin, the Student Produced Response or “grid-in.” Not only can we find ways of improving a student’s guessing chances 400-fold, we can better appreciate how questions and answers are constructed. Guessing on grid-ins may not be for everyone, but the real point is how a deep understanding of a test — not just of the topics — can lead to a higher score.
First introduced in 2005 when the SAT I became SAT Reasoning, the grid-in has lived on with the new SAT of 2016. The only change is that the number of grid-ins has grown from 10 to 13. My analysis draws on 498 problems from 48 different tests across a dozen years. Six of the tests are new SATs. Grid-ins make an interesting case study because they have never had a “guessing penalty.” This creates continuity across the old and new SATs.
“It’s a waste of time to fill in those bubbles at random because the chances of getting the correct answer that way are astronomically low.”
–Advice from a non-Compass blog
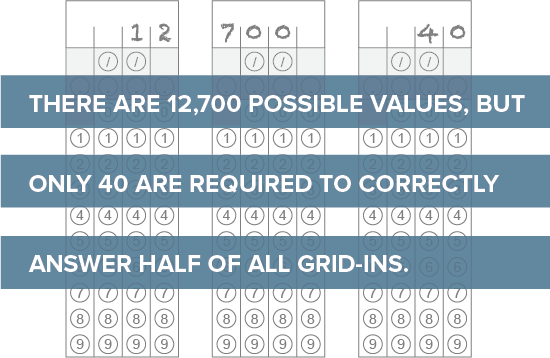
The above is common advice — I’ve even given it myself — that ignores the fact that not all answers are equally likely. It’s true that filling in bubbles at random would be foolish. For one thing, many combinations (“encodings”) would be complete nonsense.[1] There are no circumstances where “/./.“ or “1..5” are going to be correct answers. There are a total of 22,308 possible combination of bubbles and blanks (11x13x13x12). After garbage combinations are eliminated, there are still 17,936 encodings. These valid answers, though, include many duplicates. For example, the value 2 can be bubbled as “2[blank][blank][blank]”, “[blank]2[blank][blank]”, “4/2”, “2.0”, and 44 additional ways. Since a value — not an encoding — determines if a student’s answer is correct or incorrect, it makes sense to focus on the values. There are 12,700 possible values on grid-ins ranging from 0, .001, and .002 all the way to 9998 and 9999.
Random Versus Informed
If all values were equally as likely to be correct answers (and all questions had a single answer), there would be a 1 in 12,700 chance of a random value being correct on a given problem. Instead, we find that the most popular answers occur better than 1 time in 30. In other words, those high probability choices occur 400 times more frequently than by chance alone. It takes only 40 values to answer almost half of all grid-ins in the dataset! Better than 1 problem in 5 can be answered with the counting numbers 1 through 9. It’s a zero sum game, so where there are winners, we also need losers. Some values do, indeed, have an astronomically low chance of appearing.
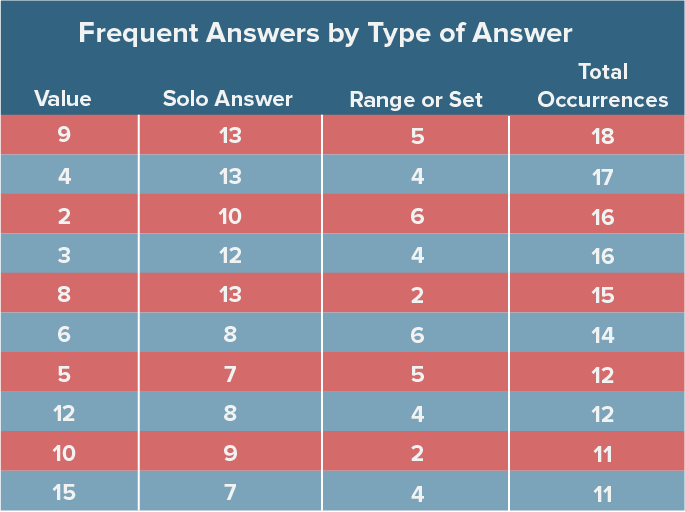
Below is a table of the most frequently occurring answers.
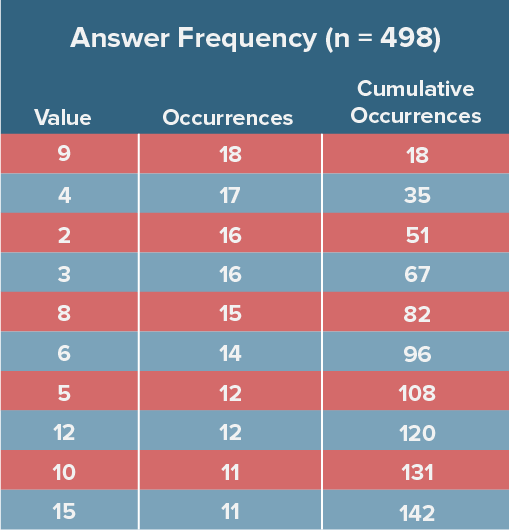
These patterns are not coincidence — they are a fundamental part of how standardized tests are constructed. An item writer is not considering the spread of correct answers across hundreds of items; an item writer is contemplating how to test a specific math standard without veering off into other standards or making the question too calculator-friendly or overloading it with too much extraneous explanation. These limitations mean that item writers can’t easily pull from the full set of possible answers. Over 70% of correct answers occur more than once in the dataset. Wrong answers can be wrong in many ways. Right answers, though, have no choice but to be right.
Integers and Non-Integers
It’s quite easy to count the number of possible integer answers — 0 to 9999 gives 10,000. Decimals are a bit trickier to count. [Technically integers are decimal numbers, but I’ll use the shorthand of “decimal” to refer to a number requiring a digit to the right of the decimal point.] From .001 to .999 there are 999 values, because the thousandth place can be bubbled. From 1 to 10, though, only the hundredth place is available (1.01, 1.02, etc.), so we can count another 891 (99×9). From 10 to 100, only the tenths digit is available (10.1, 10.2, etc.), so there are an additional 810 decimal answers (9×90). No non-integer values are possible after 99.9. This means that there are a total of 2,700 (999+891+810) decimal values.
Winners and Losers
Roughly speaking, integer answers become less likely to occur as values increase. The table below arranges 1-digit, 2-digit, 3-digit, and 4-digit integers. Despite the number of possible values increasing by almost an order of magnitude with each bump, the number of correct answers falls off quickly.

There are 9000 integers — more than 70% of all possible values — between 1000 and 9999, inclusive, yet only 1 out of 10 answers falls in that range. Choose a random value from 0-9, and the chances of getting a question right are 1 in 44. Choose a random value over 1000 and the chances of getting a question right are 1 in 91,000. It hardly bears mentioning that it takes four times as long to bubble a 4-digit answer.
Not all 4-digit integers are equally unlikely. There are only so many ways of writing good SAT questions for certain values. Of the 49 correct answers at 1000 or above, fully 6 of them are 4000. Nine thousand numbers from which to choose, and SAT writers were drawn to the siren call of 4000 more than 12% of the time from this group of values. In fact, 4000 is the most frequently occurring answer on the SAT greater than 25. 1000 (twice) and 1600 (four times) are the only other 4-digit integers showing up multiple times on this sample of 48 tests. Is it easier to write a question where the answer is the result of a simple operation such 40 x 100 or 10^3 or 5^2 x 8^2 or one where the answer is 1287? Walk 4000 miles in an item writer’s shoes.
Prime Numbers
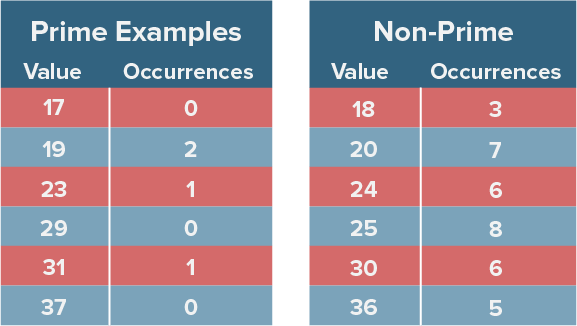
It should not come as a surprise that “large” prime numbers such as 17, 19, 23, 29, 31, etc. occur infrequently. They aren’t the product of other whole numbers, are too large — from an SAT problem perspective — to be the roots of other integers, are unwieldy as factors or coefficients, and are uncommon in typical ratio problems. Instead, the structure of SAT problems tends to naturally favor values such as 24, 25, 30, 36, and 40.
Fractions
The flexibility of the grid-in means that question writers don’t have to limit themselves to integers. Of particular value on no calculator or calculator-neutral problems is the ability to encode fractions. A student does not need to know that 1/8 equals .125 when she can simply bubble “1”, “/“, “8”.
Given what we saw with integer answers, it is not surprising that the most common fraction answers involve numerators and denominators of 1, 2, 3, 4, and 5.
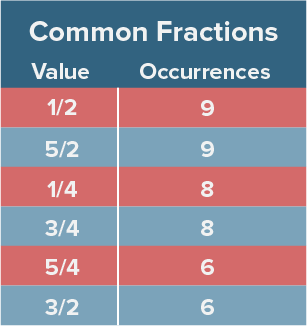
Of the 115 non-integer answers that allowed for fractional encoding, only 8 had both numerators and denominators that fell outside of the 1-5 range — 9/22, 7/15, 8/15, 8/7, 10/7, 15/7, 27/8, and 64/9. Among the 498 answers analyzed, I’d like to nominate 9/22 as the quirkiest. Fractional encoding. 4 columns required. 9 as the first column. A unique denominator. And a repeating decimal that doesn’t repeat until out of view (4.090909… gets encoded as simply 4.09).
While all fractions can be encoded as decimals — because the SAT allows rounding and truncation — not all decimals can be encoded as fractions. For example, Practice Test #3 for the new SAT has a question with a correct answer of 58.6. Any attempt to represent this as a fraction — such as 293/5 — would run out of columns. In contrast, 47.5 from the May 2006 SAT fits into the grid as 95/2. Decimal answers that cannot be bubbled as fractions — take 1.02 and 3.84 as additional examples — are uncommon, appearing on only about 1% of problems.
Decimals, Ranges, and Sets
When looking at the probability of a decimal value qualifying as a correct answer, things get far more complex. Answers with a range of acceptable values have a disproportionate impact. A quirk of the grid-in is that multiple answers/values can be correct. This allows flexibility for item writers to create questions that would not work as multiple-choice problems — something the test makers took advantage of on 23 problems. In the example below, the value must be greater than 0 and less than 1. A student is free to choose any value in that range — .001, 1/3. .5, and .999 are all correct. If we are counting values rather than encodings, there are exactly 999 correct answers.

For the student picking values strictly at random, range problems can be a boon. The student would have a 999/12,700 (approximately 8%) chance of guessing an answer that falls between 0 and 1. For the random bubbler, the “easiest” question from my corpus is one from May 2011 that allowed for any value greater than 0 and less than 2 (1099 correct answers). Unfortunately for the random guesser, these questions are uncommon. Only 5 questions had more than 900 acceptable values.
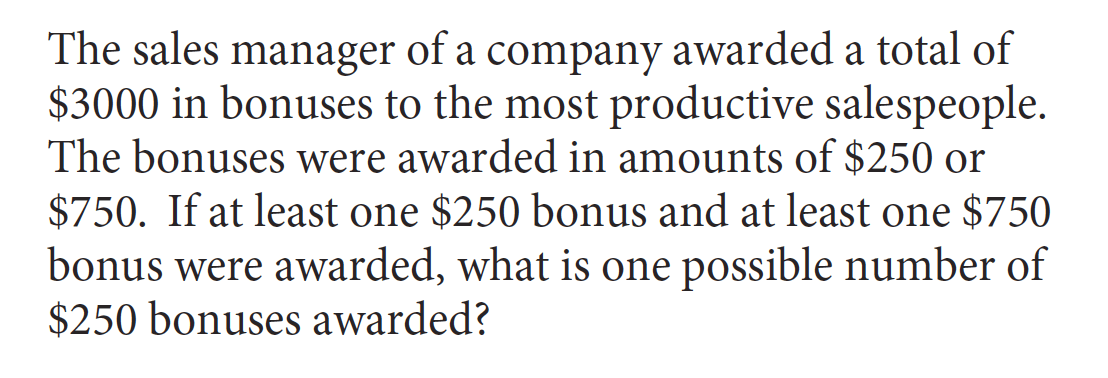
The SAT also allows for a set of answers that is not part of a single range, and this type of question turned up 28 times out of 498 problems. In the example below, 3, 6, and 9 are all correct values.
Some of the most frequently correct answers get an extra boost from ranges and sets. The original frequency table can be refined to distinguish between times when an answer is correct as the sole correct value and the times when it is correct as part of a range or set. Amazingly, .001 is correct on 8 different range problems. The same is true for .002 and about two hundred other “small” decimals.
Rights and Wrongs of Rounding
Repeating decimals such as 5.33 (16/3) occur about one problem of every 20. A special case of repeating decimals involves whether to truncate or to round. In the case of 16/3, the problem does not arise, because 5.33 results either way. Students face a choice with 2/3, however, on whether or not to go with .666 or .667.
Compass math tutors have patiently explained to thousands of students how either answer is acceptable. Was the time well spent? It turns out that there were 16 questions where the issue arose, so the explanations likely alleviated the occasional bout of anxiety. The new SAT recently had a unique situation where it allowed students to round 43.5 to 43 or 44. This violates the strict interpretation of SAT rounding regulations (43.5 fit within the grid structure, so rounding was not required), but the problem involved miles per hour. College Board apparently felt that some students would assume an integer value even though the problem left this unspecified. It dodged the differing guidance of rounding rules (round up, round down, round to the nearest even) by allowing for both 43 and 44. Leniency over accuracy.
Fractions can be rounded to decimals, but decimals cannot be approximated as fractions. If an answer is 64/9 (October 2013 SAT), then 7.11 is acceptable. If the answer were 7.11, though, 64/9 would not be acceptable. The answer to question 38 on section 4 of the first released new SAT was exactly 6.11. 55/9 would not have been accepted, even though it truncates to 6.11. The point is probably moot, since there is no reason to think that a student would have obtained 55/9 as a solution, especially since the question involved dollars and cents.
Staying Rational
An irrational number may have squeaked into a grid-in section at some point in its history, but none appeared on any of the 48 tests surveyed. No values of pi, no square root of 2, no cosine 30º.
And the Law Won
One of the more peculiar facts about many distributions of values is that they follow Benford’s Law. The first digit of a set of values tends toward a predicted frequency. Benford’s Law can even be used in certain fraud investigations, because fudged data will often violate its predictions. It turns out that grid-ins roughly follow the expected probabilities. Factoring out 0 and questions that allow for multiple correct values leaves 431 problems. Answers where the first non-zero digit is a 1 such as .01, 1.2, and 1459 occur twice as frequently as those beginning with a 2 and almost seven times as frequently as answers beginning with a 9. We saw from the table of the most frequently occurring answers that the value 9 popped up more than the value 1, but when you account for .125 versus .9 and 150 versus 900, 1 dominates as the first digit.

Least Likely to Succeed
It’s impossible, of course, to identify a “least likely” answer. Among the 12,700 possible values, I think there are many that will never show up on an SAT. If forced — at the tip of a No. 2 pencil — to choose, I’d probably go with a large prime such as 9857. It would also take a gutsy item writer to slip 9999 past the review board.
Meet the New Boss, Same as the Old Boss
Although the grid-in structure has not changed on the redesigned SAT, the questions have been swept up by the overall test changes. The old SAT allowed for a calculator on all math problems, but a calculator was never required. The new SAT has No Calculator and Calculator math sections with 5 and 8 grid-ins, respectively. Several math problems on the Calculator section will typically provide stumbling blocks for students without calculators. Expecting a student to divide 321 by 7 would have been highly unlikely on the old SAT, but it’s not off-limits on the Calculator section of the new SAT. In theory, this opens up a wider range of questions and answers for the test makers, as there were a limited number of ways of writing a calculator-neutral item with an answer of 7941 on the old SAT. This seems to have played out only on a very limited number of problems (the question with 6.11 as the answer was certainly one of them). Almost 75% of new SAT grid-ins involve values that had previously appeared on at least one of the 42 old SATs in the sample.
The new SAT also displays the same predilection to repetition as the old SAT. It only takes nine values to correctly answer 26 different questions — exactly one-third of new SAT grid-ins. In fact, four of the six SAT forms include a question with a correct answer of 7. Guessing 2 on every question would have rewarded a student with two correct answers on Practice Test #3 and produced correct answers on three other forms. The counting digits from 1-9 give 23 correct answers — right in line with what we observed on the old SAT.
The Answer to the Ultimate Question of Life
No treatise on numbers and answers would be complete without 42. Those who have read The Hitchhiker’s Guide to the Galaxy know that 42 is the “Answer to the Ultimate Question of Life, the Universe, and Everything.” It also happens to be the correct answer only once on 48 SATs. If question 15 on section 3 from the January 2009 SAT is, indeed, the ultimate question, then the universe and everything revolves around the shaded region of a rectangle.
Will it Raise My Score?
The ultimate question for most students, though, is “Will it raise my score?” The most common correct answers on grid-ins occur approximately one time out of 26. There are 13 grid-ins on each new SAT. A correct answer is worth approximately 10 points. Based on those figures, we can assume that a student who takes dozens of tests with a strategy of answering “9″ on every grid-in will a) be extremely displeased at having to guess on every grid-in on dozens of tests and b) average a score about 5 points higher than she would have with a strategy of leaving every grid-in blank. On a per-problem basis, informed guessing on grid-ins has a return of approximately four-tenths of a point on the 200-800 scale. [Students who make headway on a problem should be making a best guess based on their actual work.]
Compass would not have survived if its sole claim to success was raising a student’s average Math SAT score from 320 to 325. I don’t actually expect many students to invest the time or pencil lead in guessing on grid-ins, and I’ve failed them if they find themselves coming up completely empty on more than a few grid-ins (I do expect students to bubble in their best stab at a solution). Why write such a long post about what, then, seems like a minor topic? Because I feel the need to practice what I preach to my students and tutors — detective work pays off in the long-term and is a valuable skill in and of itself. College Board and ACT would like one to believe that the current incarnations of their college admission tests are purely tests of academic achievement and “college readiness.” In fact, the exams reward a host of skills. Like a team of sloppy burglars, test makers leave fingerprints and DNA everywhere. Patterns are left in plain sight. Topics are repeated. Clues are discoverable. If guessing on grid-ins is feasible, one can imagine the possibilities when test makers have already narrowed things from 12,700 suspects to four. Sleuthing skills should join with math knowledge in every student’s approach to testing.


Very interesting article, Art! As a former test developer for ETS, I am a connoisseur of fine standardized test items, and this was a good read. Although I don’t anticipate that my new perspective on random grid-ins is going to change my approach to SAT Math Prep, I appreciate the time and thought you put into this.
Thank you, Mary. It was a fun post to write (far more enjoyable than taking ACT to task again about essay grading).